
Bitcoin’s High-Stakes September: Will We See a Breakout or Breakdown?
Uncover the Game-Changing Signals and Market Forces Poised to Shape Bitcoin’s Next Major Move | That's TradingNEWS
Bitcoin (BTC): Navigating September's Potential Volatility and Long-Term Prospects
Seasonal Weakness and Technical Indicators Suggest Potential Challenges
Bitcoin (BTC) is entering September with several indicators pointing to potential volatility and downside risk. Historically, September has been a challenging month for Bitcoin and other risk assets, and current technical indicators suggest that this trend may continue. According to recent analysis, Bitcoin is showing signs of short-term exhaustion, with indicators like the DeMARK showing minor signs of upside exhaustion. The stochastics, which measure momentum, are poised to turn below 80%, increasing the likelihood of Bitcoin retesting support around $56,500.
Further compounding the bearish sentiment, intermediate-term momentum remains weak, and a counter-trend signal on the monthly chart supports the possibility of another two months of corrective price action. This could see Bitcoin struggling to maintain its recent gains, particularly as macroeconomic factors such as a strengthening U.S. dollar could exert additional downward pressure. The Dollar Index, which typically moves inversely to Bitcoin, is primed for a rebound, which could further weigh on Bitcoin's price.
Mixed Reactions in the Derivatives Market
In the derivatives market, Bitcoin traders are showing a mixed reaction following the recent Jackson Hole economic symposium. While there has been an increase in the buying of call spreads, indicating some optimism for future price increases, there has also been significant selling of Bitcoin call options with a strike price of $100,000. This suggests a cautious outlook among traders, with many anticipating that any rally in Bitcoin’s price may be limited or short-lived.
The current market conditions indicate a potential for continued downward or sideways movement in Bitcoin's price beyond September. The technical analysis firm expects anemic mid-term momentum for Bitcoin, with broader market conditions, including the strength of the U.S. dollar, acting as headwinds.
Price Dynamics and Support Levels: Where is Bitcoin Headed?
Bitcoin’s price has recently been fluctuating within a range of $56,000 to $62,800, and despite breaking out to a peak of $65,000, buyer interest seems to be lacking the necessary support to sustain higher levels. The cryptocurrency is currently trading around $62,800, and while the short-term structure appears positive, the medium-to-long-term trend remains uncertain.
Bitcoin has bounced above its 50-day and 200-day moving averages, but these averages remain crossed downwards, suggesting that the recent recovery could be temporary. However, Bitcoin has re-entered its control point just below the $60,400 support level, which could provide some reassurance to investors. Momentum indicators also reflect this cautious optimism, with oscillators signaling a slight rebound in momentum.
Derivatives Market Sentiment: Analyzing Open Interest and Funding Rates
Recent fluctuations in Bitcoin have been accompanied by an increase in open interest, which, alongside slightly positive funding rates, suggests growing optimism among speculators. The increase in open interest, coupled with a positive funding rate, indicates that the market is leaning towards a more bullish outlook in the short term. However, the market remains cautious, as liquidation events and sudden price drops could trigger a “liquidation cascade,” potentially driving Bitcoin back down to previous lows.
In terms of key technical levels, Bitcoin’s price could find support around the 200-day Exponential Moving Average (EMA) near $62,000. A bounce from this level could see Bitcoin retesting the $65,000 resistance, with potential for further gains up to $70,000. However, failure to hold above $62,000 could see Bitcoin revisiting lower support levels around $56,200 or even $49,200, representing a significant downside risk.
Spot ETF Inflows and Long-Term Bullish Indicators
Despite the short-term uncertainty, there are several bullish indicators for Bitcoin in the long term. Notably, U.S. spot Bitcoin ETFs have recorded strong inflows for 12 consecutive days, signaling robust demand from institutional investors. These inflows contrast with outflows in Ether (ETH) spot ETFs, highlighting Bitcoin’s dominance in the market.
Additionally, on-chain data shows an increase in active Bitcoin addresses, rising to 671,000 from 538,000, indicating growing interest and activity in the Bitcoin network. The rise in new addresses further supports the notion that demand for Bitcoin remains strong within the crypto community.
Geopolitical Risks and Macroeconomic Factors
The global macroeconomic environment also plays a critical role in Bitcoin’s price dynamics. Recent geopolitical tensions, particularly in the Middle East, have contributed to market volatility, affecting risk sentiment across global markets. Bitcoin, often seen as a speculative asset, has not been immune to these broader market movements.
In addition to geopolitical risks, the anticipation of potential interest rate cuts by the Federal Reserve adds another layer of complexity to Bitcoin’s outlook. Historically, Bitcoin has benefited from lower interest rates, which increase liquidity in the market and support speculative investments. The possibility of a rate cut in September, particularly if the U.S. economy shows signs of weakening, could provide a tailwind for Bitcoin and other cryptocurrencies.
Mining Sector Consolidation: A Look at Industry Trends
In the Bitcoin mining sector, consolidation is becoming a key trend. The recent halving event in April has driven miners to secure large-scale data center capacities with access to low-cost power. This trend is exemplified by Bitfarms Ltd’s planned acquisition of Stronghold Digital Mining Inc. and the ongoing proxy battle with Riot Platforms, which has been buying up Bitfarms’ stock and pushing for management changes.
This consolidation, while aimed at securing strategic assets, also raises concerns about the centralization of mining power, which could go against the decentralized ethos of Bitcoin. The long-term impact of this trend on the Bitcoin network remains to be seen, but it is a development that market participants will be watching closely.
Key Price Levels and Market Hypotheses
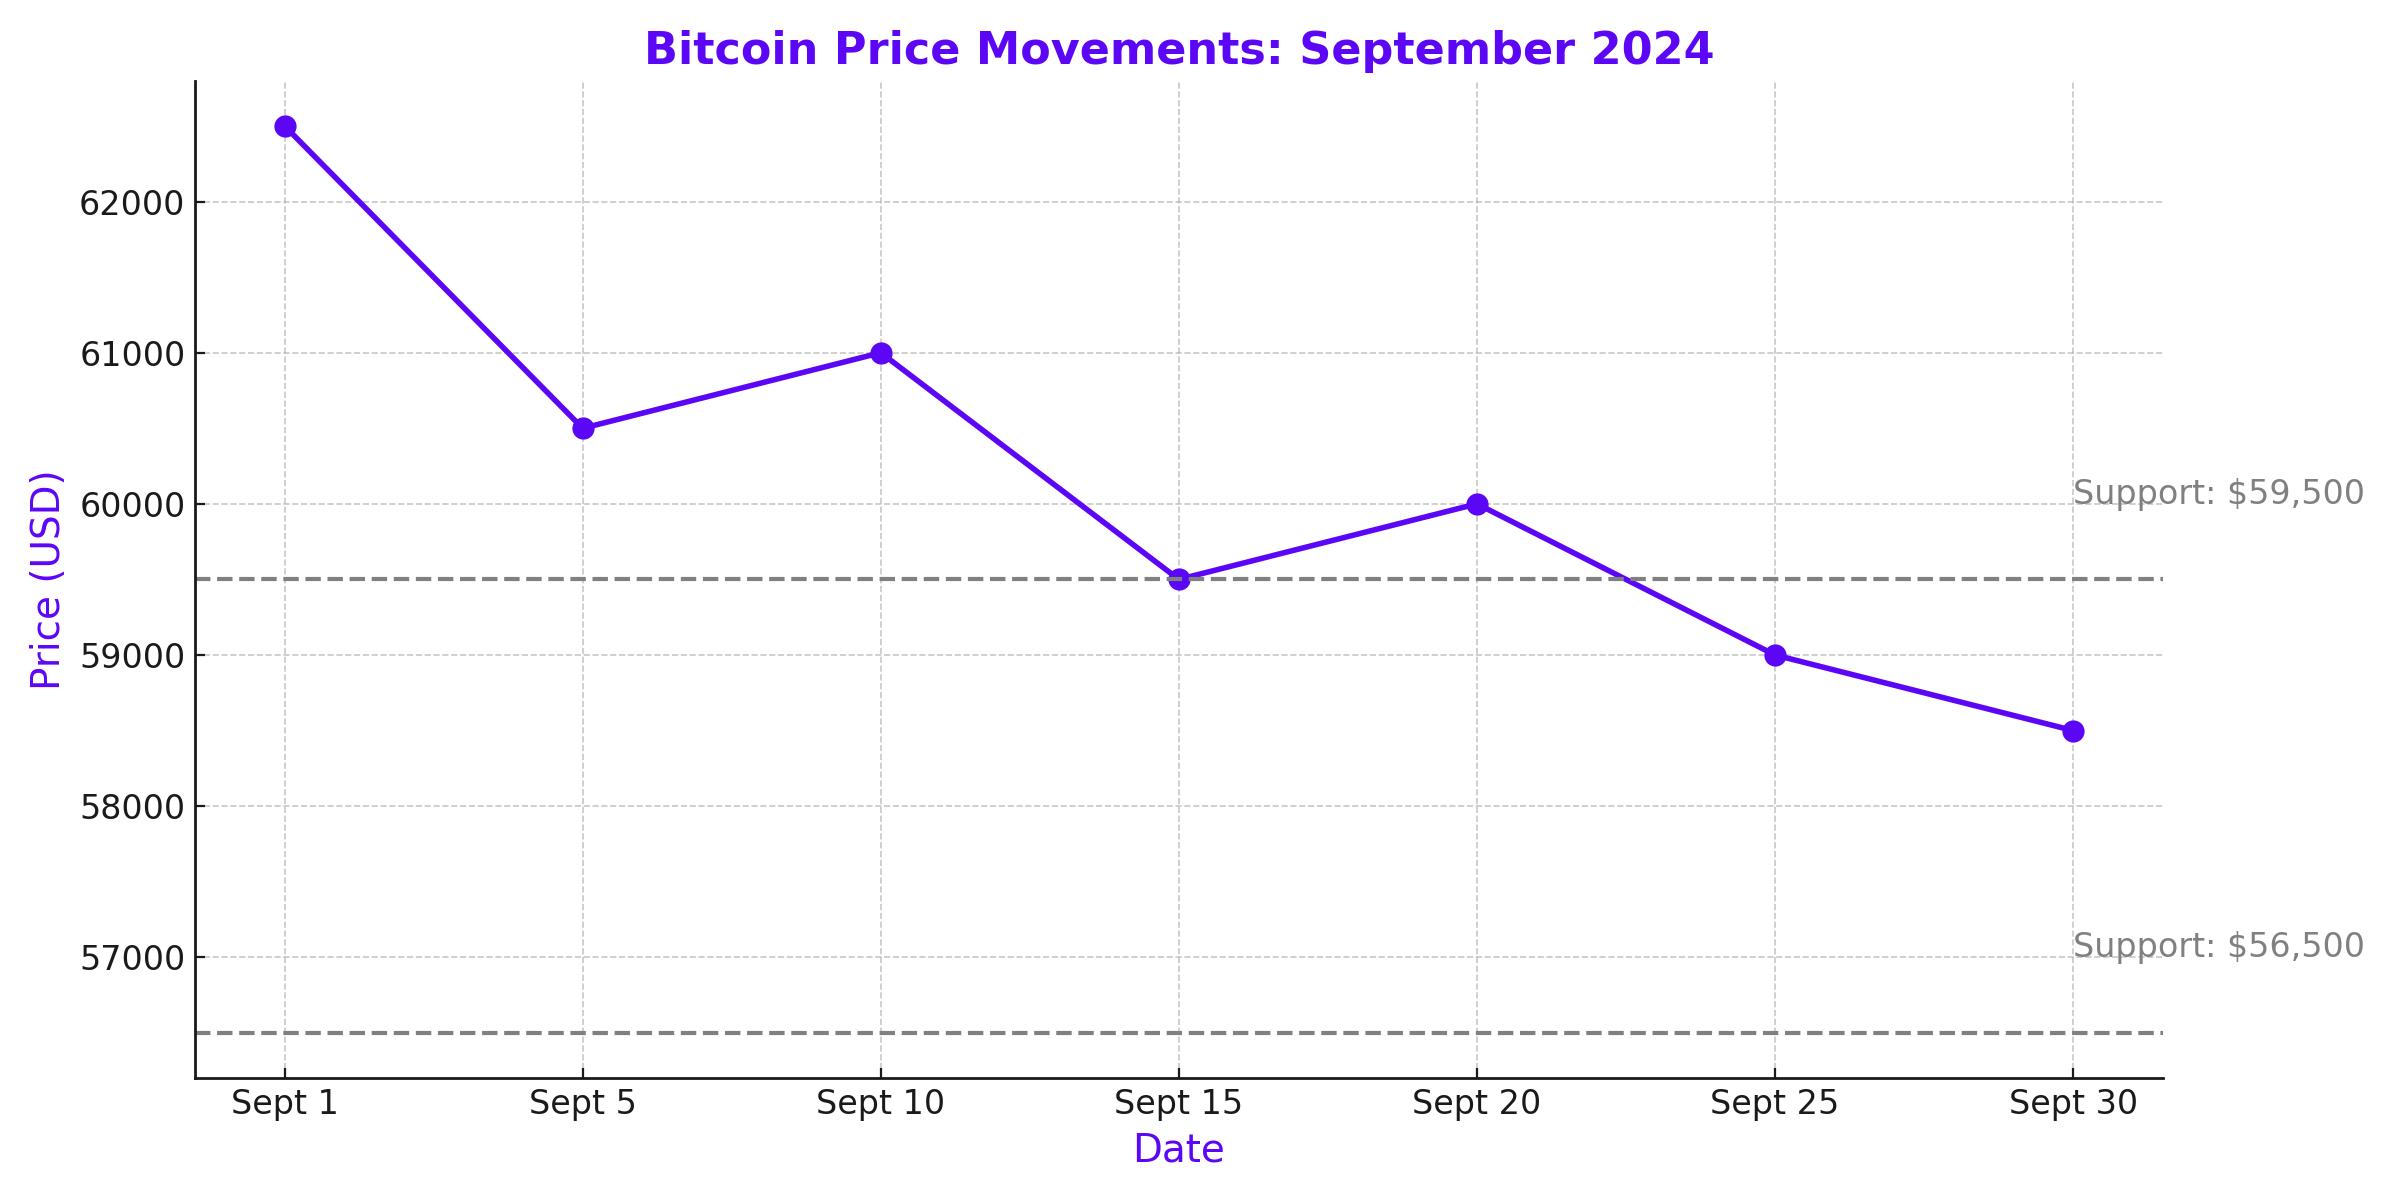
Looking ahead, Bitcoin’s price action will be closely watched at several key levels. If Bitcoin can stay above $59,500, there is potential for a rise towards $65,600, with further resistance around $67,000. A continuation of this upward momentum could see Bitcoin testing $70,000 or even $72,000, representing a 15% rise from current levels.
Conversely, if Bitcoin fails to hold above $59,500, a decline towards $56,200 or lower could be in the cards. The next major support levels to watch would be around $55,000, $54,500, and potentially as low as $49,200, which would represent a 21% drop from current levels.
Conclusion
Despite the notable support after recent rebounds, Bitcoin’s trend remains uncertain. While the recovery from recent lows is encouraging, signs of fragility persist, suggesting that caution is warranted. Monitoring Bitcoin’s price action at key support and resistance levels will be crucial in determining the next direction of the market. Investors should also remain vigilant against potential “fake outs” and market squeezes, and consider the broader macroeconomic and geopolitical factors that could impact Bitcoin’s price in the coming months.
That's TradingNEWS
Read More
-
SPYI ETF at $52.59: 11.7% Yield, 94% ROC and Near S&P 500 Returns
04.01.2026 · TradingNEWS ArchiveStocks
-
XRPI and XRPR Rally as XRP-USD Defends $2.00 on $1.2B XRP ETF Inflows
04.01.2026 · TradingNEWS ArchiveCrypto
-
Natural Gas Price Forecast: NG=F Eyes $4.30 if Storage Draws Tighten
04.01.2026 · TradingNEWS ArchiveCommodities
-
USD/JPY Price Forecast - USDJPY=X at 156.91: 157.75 Breakout Sets 160 Target as Fed Jobs Week Tests The Dollar
04.01.2026 · TradingNEWS ArchiveForex