
Comparative Performance and Competitor Analysis of SPUU vs. SSO ETFs
Detailed Comparison of Expense Ratios, Asset Base, Trading Volume, and Performance Metrics for SPUU and SSO | That's TradingNEWS
Comparative Performance and Competitor Analysis
Comparison with ProShares Ultra S&P500 ETF (SSO)
The Direxion Daily S&P 500 Bull 2X Shares (NYSEARCA: SPUU) is frequently compared with the ProShares Ultra S&P500 ETF (NYSEARCA: SSO) due to their similar investment objectives. Both ETFs aim to deliver twice the daily performance of the S&P 500 index, but they differ in several key aspects that can influence investor decisions.
Expense Ratios
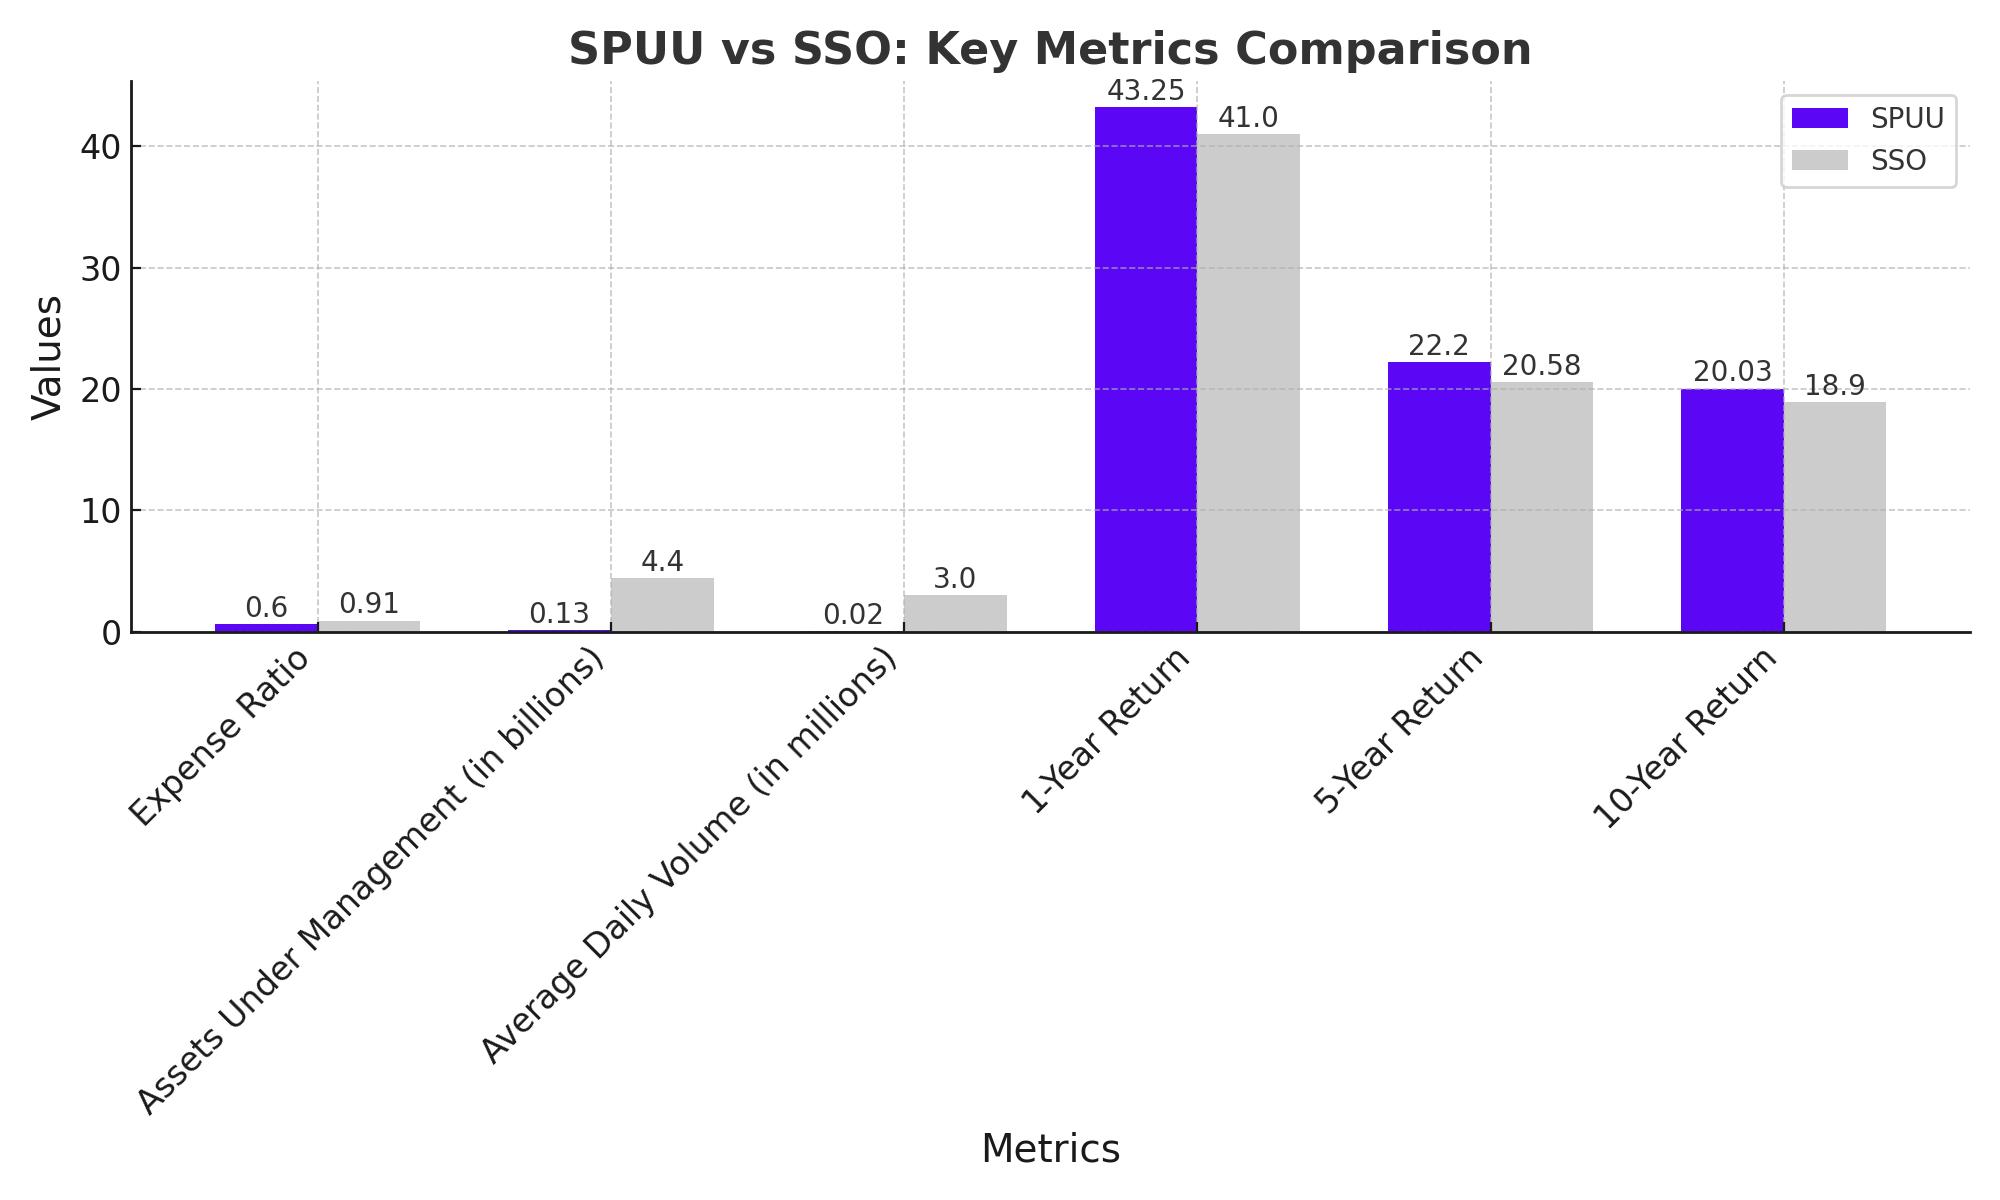
One of the primary differences between SPUU and SSO is the expense ratio. SPUU offers a lower expense ratio of 0.60%, making it a more cost-effective option for investors looking to minimize fees. In contrast, SSO has a higher expense ratio of 0.91%. Over the long term, lower expense ratios can significantly impact net returns, especially in a leveraged product where fees can compound.
Asset Base and Trading Volume
While SPUU has a cost advantage, it has a smaller asset base compared to SSO. SPUU manages net assets worth $129.16 million, whereas SSO boasts a more substantial asset base with assets under management (AUM) of approximately $4.4 billion. This larger asset base often translates to better liquidity and tighter bid-ask spreads, making SSO more efficient for larger trades.
The average daily trading volume also reflects this difference. SPUU's average volume is around 16,045 shares, while SSO sees a significantly higher volume, averaging about 3 million shares per day. Higher trading volume in SSO can provide better execution and lower transaction costs, an essential factor for active traders.
Performance Metrics
When comparing performance, both ETFs show impressive returns, albeit with slight variations. Over the past year, SPUU has delivered a return of 43.25%, while SSO has posted a slightly lower return of approximately 41%. This difference, although marginal, highlights SPUU’s potential to slightly outperform its counterpart under certain market conditions.
Historical Returns
Analyzing the longer-term performance provides additional insights. Over the past five years, SPUU has achieved an annualized return of 22.20%, compared to SSO’s 20.58%. Similarly, the ten-year annualized return for SPUU is 20.03%, while SSO stands at 18.90%. These figures demonstrate SPUU’s consistent ability to deliver higher returns over extended periods, albeit with higher risk due to its leveraged nature.
Volatility and Risk
Leveraged ETFs are inherently more volatile than their non-leveraged counterparts. Both SPUU and SSO amplify the daily movements of the S&P 500, but this also means they can suffer more significant losses during market downturns. Investors must be mindful of the increased risk associated with these products. SPUU’s beta, a measure of its volatility relative to the market, is approximately 2.00, indicating it is twice as volatile as the S&P 500.
Practical Considerations
For investors considering SPUU or SSO, several practical factors should be considered. SPUU’s lower expense ratio makes it attractive for cost-conscious investors, while SSO’s higher liquidity and larger asset base can be advantageous for those prioritizing trading efficiency. Additionally, the slight performance edge of SPUU may appeal to those seeking higher returns, albeit with the acceptance of increased risk and potential volatility.
That's TradingNEWS
Read More
-
GPIX ETF 8% Monthly Yield and S&P 500 Upside at $53
13.01.2026 · TradingNEWS ArchiveStocks
-
XRP ETFs XRPI, XRPR and Bitwise XRP Pull In $1.5B as XRP-USD Stalls Around $2.13
13.01.2026 · TradingNEWS ArchiveCrypto
-
Natural Gas Price Forecast: NG=F Climbs Off $3.00 Floor as Cold Snap and LNG Flows Lift UNG
13.01.2026 · TradingNEWS ArchiveCommodities
-
USD/JPY Price Forecast - USDJPY=X Charges Toward ¥159 as Japan Election Fears Hit the Yen
13.01.2026 · TradingNEWS ArchiveForex