
Direxion Daily S&P 500 Bull 2X Shares (NYSEARCA: SPUU) ETF – Market Performance
In-Depth Analysis of SPUU's Trading Data, Sector Exposure, and Competitive Edge | That's TradingNEWS
Direxion Daily S&P 500 Bull 2X Shares (NYSEARCA: SPUU) – Market Performance and Dynamics
Current Trading Overview
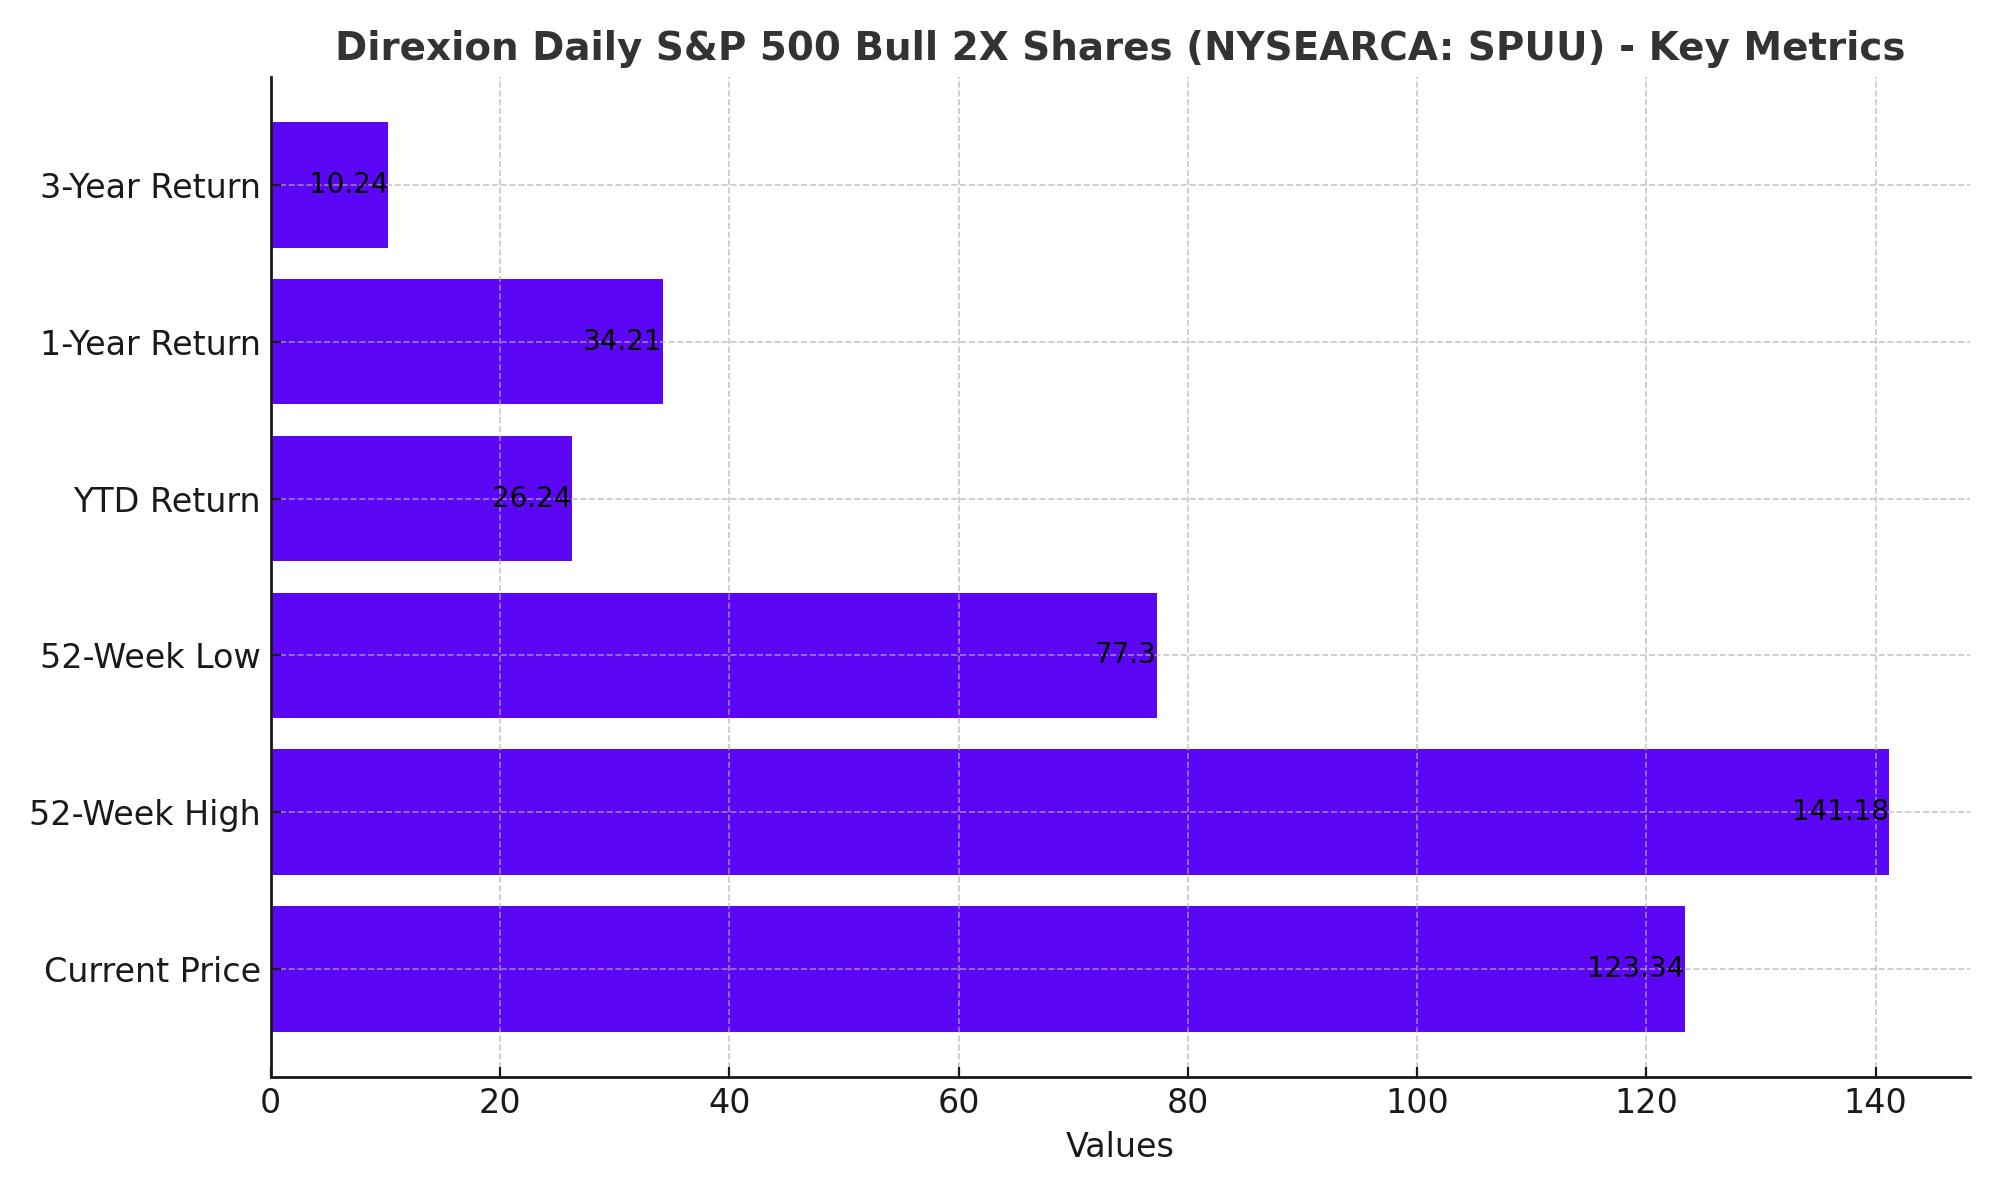
As of the most recent trading session, the Direxion Daily S&P 500 Bull 2X Shares (NYSEARCA: SPUU) is trading at $123.34, marking a 4.94% decline from its previous close of $129.75. The ETF opened at $126.37 and traded within a range of $123.00 to $126.92 during the day. Over the past 52 weeks, SPUU has seen considerable volatility, with a range spanning from $77.30 to $141.18.
Volume and Assets
The trading volume for SPUU currently stands at 26,383 shares, which is significantly higher than its average daily volume of 16,045 shares. This increased activity suggests heightened investor interest or market volatility. SPUU holds net assets worth $129.16 million, with a Net Asset Value (NAV) of $129.95. The expense ratio for the ETF is 0.61%, and it has a price-to-earnings (PE) ratio (TTM) of 32.18, offering a yield of 0.84%.
Returns and Performance Metrics
Year-to-date (YTD), SPUU has delivered a remarkable daily total return of 26.24%, outpacing many of its benchmarks. Over the past year, the ETF has returned 34.21%, reflecting strong performance in a bullish market environment. The three-year return stands at 10.24%, highlighting its long-term potential. Monthly returns are also noteworthy, with a one-month return of 6.74% and a three-month return of 6.66%, indicating consistent performance over various time frames.
Leveraged ETF Mechanics
Understanding Leverage in SPUU
Leveraged ETFs like SPUU aim to provide twice the daily performance of their underlying index, in this case, the S&P 500. This leverage is achieved through the use of financial instruments such as swap agreements, futures contracts, and other derivatives. While this leverage can amplify gains in a rising market, it can also exacerbate losses and lead to significant volatility and decay over time due to the compounding effects of daily returns.
Performance Comparison
Analyzing SPUU’s performance over different time frames illustrates the effects of leverage. Over the past five years, SPUU has achieved an annual return of 22.20%, while its ten-year return stands at 20.03%. These figures underscore the ETF’s potential to deliver high returns but also highlight the inherent risks. During periods of high market volatility, leveraged ETFs may underperform the underlying index due to the compounding of daily losses.
Market Conditions and Economic Indicators
Interest Rates and Economic Activity
The Federal Reserve's recent decision to maintain interest rates within the 5.25%-5.50% range, along with indications of potential rate cuts, plays a crucial role in influencing SPUU's performance. Lower interest rates typically reduce borrowing costs, which can stimulate economic activity and positively impact stock market performance. This environment is generally favorable for equities and, by extension, leveraged ETFs like SPUU that amplify equity market movements.
For example, a potential rate cut could provide further momentum for SPUU, driving prices higher as economic conditions become more favorable for growth. However, investors must also be aware of broader economic indicators such as inflation rates, employment data, and geopolitical tensions, which can introduce volatility and impact market sentiment.
Annual Performance and Market Cycles
Yearly Returns Analysis
Analyzing the annual performance of NYSEARCA:SPUU reveals its substantial gains during bullish market periods. In 2019, SPUU achieved a remarkable return of 66.85%, showcasing the strong performance of the S&P 500 index. This was followed by another impressive gain of 61.26% in 2021. However, in 2022, the ETF faced a steep decline of 38.72%, highlighting the heightened risk and volatility inherent in leveraged ETFs. These performance metrics underscore the critical importance of market timing when investing in SPUU. For instance, in 2020, amid the COVID-19 pandemic-induced market crash, SPUU experienced significant volatility before rebounding strongly during the subsequent recovery phase, ending the year with a 21.89% gain.
Market Cycles and Economic Impact
SPUU's performance is intrinsically linked to broader economic cycles. During periods of economic expansion, such as the recovery following the 2020 pandemic downturn, SPUU tends to deliver robust returns. This trend was evident in 2021, where economic reopening and stimulus measures fueled market optimism. Conversely, economic contractions and increased market volatility can lead to substantial losses for SPUU. For example, the ETF's performance in 2022, with a decline of 38.72%, was impacted by global economic uncertainties and tightening monetary policies. These cycles illustrate the ETF's sensitivity to macroeconomic factors and market conditions, necessitating vigilant monitoring by investors.
Sector Allocation and Top Holdings
Sector Exposure
SPUU offers exposure to the S&P 500, encompassing a broad range of sectors that mitigate sector-specific risks. Key sectors include technology, healthcare, and consumer discretionary, which significantly influence SPUU's overall performance. The technology sector, for instance, has a substantial impact due to its heavy weighting in the S&P 500. This sectoral diversity means SPUU's returns are influenced by the performance of leading tech companies and other significant industries within the index.
Top Holdings
The ETF's top holdings consist of some of the most influential companies in the market, driving its performance. Microsoft Corporation (MSFT) constitutes 6.54% of SPUU's total assets, followed closely by NVIDIA Corporation (NVDA) at 5.99%, and Apple Inc. (AAPL) at 5.98%. Other major holdings include Amazon.com, Inc. (AMZN), Meta Platforms, Inc. (META), and Alphabet Inc. (GOOGL, GOOG). The performance of these tech giants plays a crucial role in determining SPUU's returns. For instance, in periods where these companies report strong earnings, SPUU typically benefits significantly.
Comparative Performance and Competitor Analysis
Comparison with ProShares Ultra S&P500 ETF (SSO)
SPUU is frequently compared with other leveraged ETFs like the ProShares Ultra S&P500 ETF (SSO). Both ETFs aim to deliver 2X the daily performance of the S&P 500, but SPUU has a lower expense ratio of 0.60% compared to SSO's 0.91%. Despite this cost advantage, SPUU's lower asset base and trading volume can impact its liquidity and trading efficiency. Over the past year, SPUU has delivered a return of 43.25%, outperforming many leveraged peers, including SSO. This performance difference, albeit slight, highlights SPUU's competitive edge in terms of cost efficiency and return.
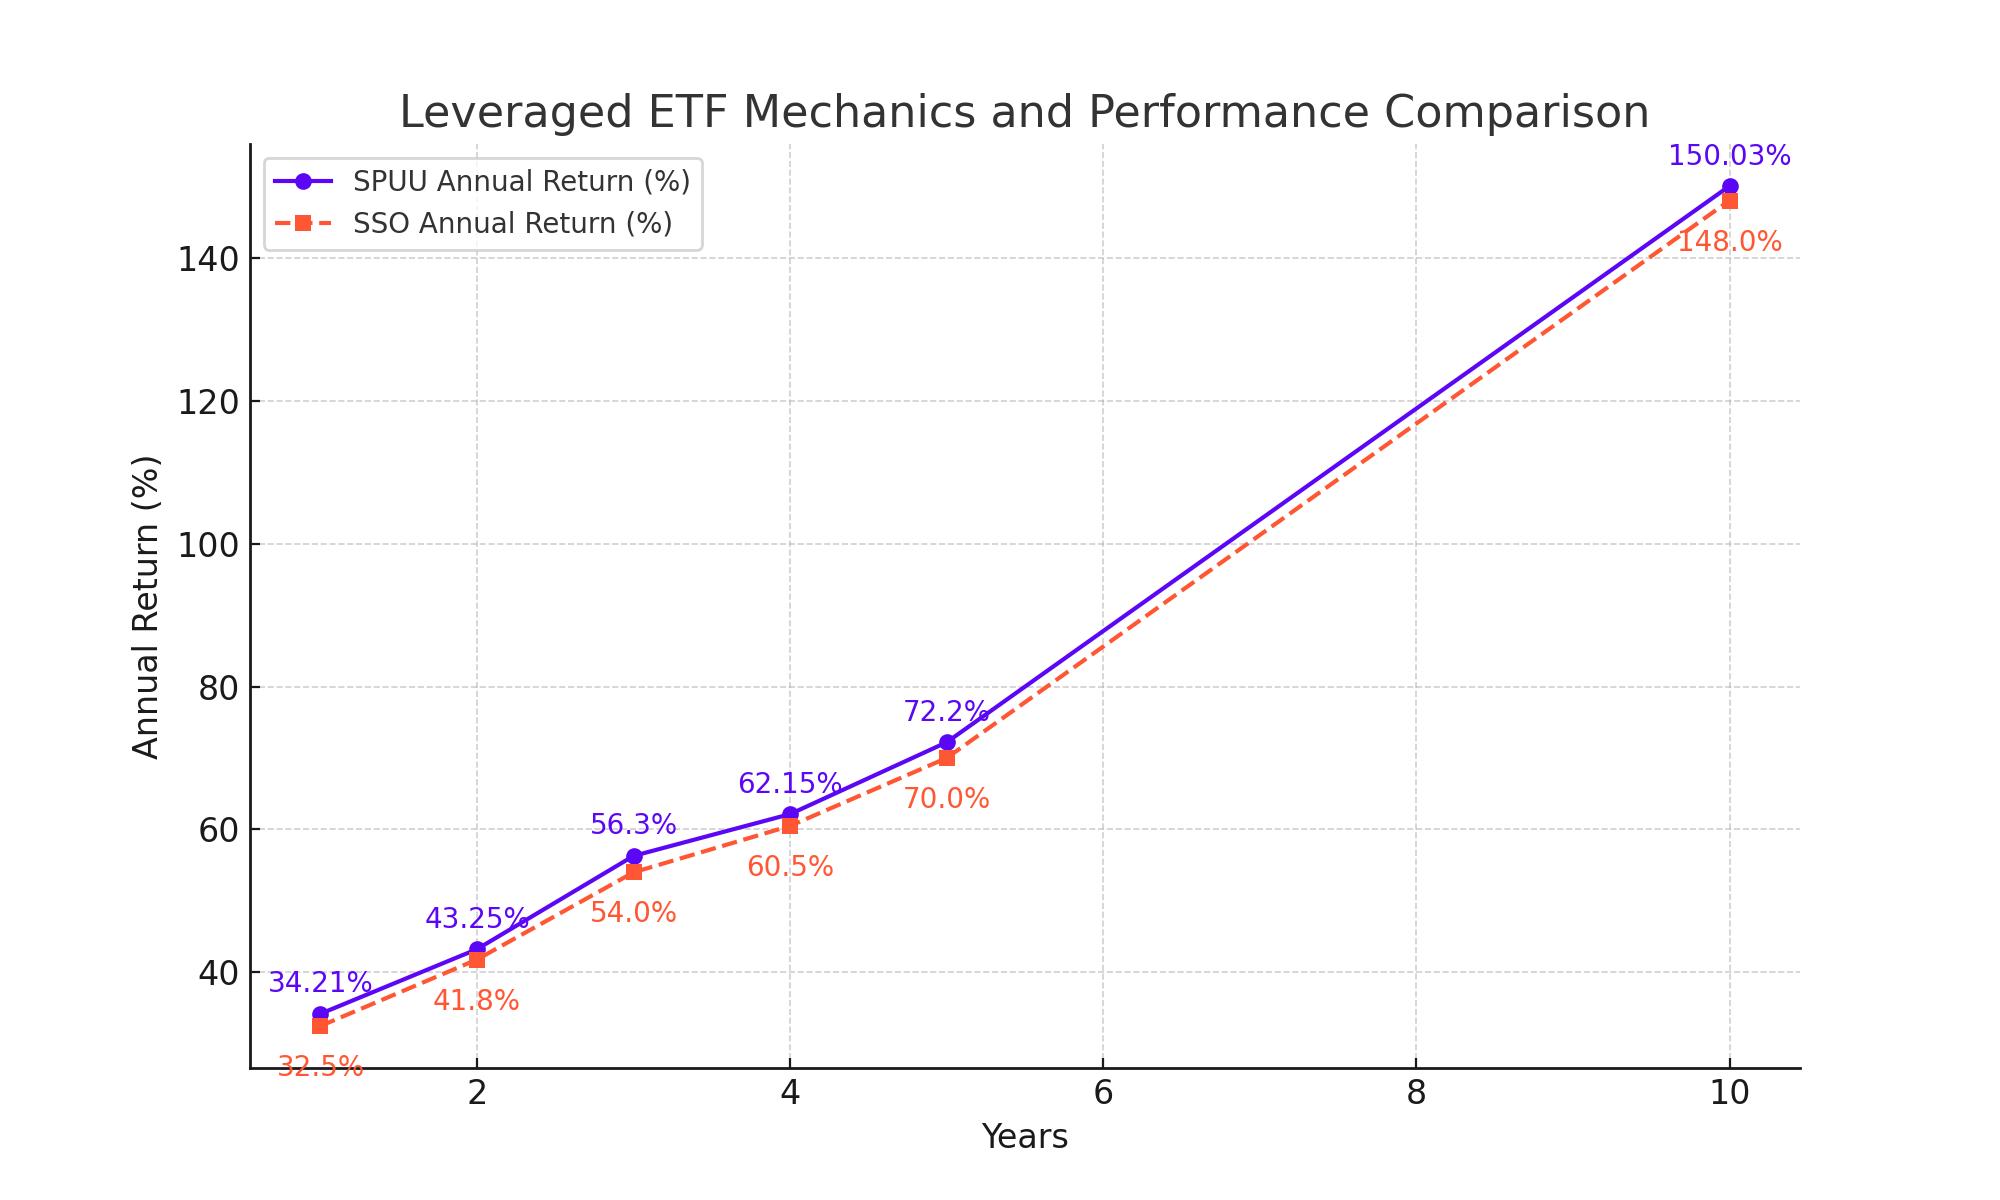
Performance Metrics
In terms of performance metrics, SPUU has shown a consistent trend of outperforming its peers due to its strategic exposure and cost structure. The ETF's 1-year return stands at 43.25%, which is notably higher than many other leveraged ETFs. This performance is reflective of the underlying S&P 500 index's strength and SPUU's effective leverage strategy. For comparison, SSO's return for the same period was slightly lower, indicating that despite similar leverage objectives, SPUU’s cost efficiency provides an additional advantage to investors.
Conclusion
The Direxion Daily S&P 500 Bull 2X Shares (NYSEARCA: SPUU) exhibits substantial volatility, trading at $123.34, down 4.94% from its previous close. With a wide 52-week range from $77.30 to $141.18, SPUU demonstrates significant market sensitivity. Despite a higher-than-average trading volume of 26,383 shares, the ETF's net assets total $129.16 million with a NAV of $129.95. The expense ratio is competitively low at 0.61%, enhancing its appeal among cost-conscious investors.
Year-to-date, SPUU has delivered an impressive 26.24% return, outpacing benchmarks and reflecting strong bullish market performance. Over a one-year period, it boasts a 34.21% return, underscoring its potential during market upswings. However, the ETF's leveraged nature means it can suffer pronounced declines in bearish conditions, as evidenced by a 38.72% drop in 2022. Its performance highlights the importance of market timing and strategic entry points.
In comparison to the ProShares Ultra S&P500 ETF (SSO), SPUU offers a lower expense ratio of 0.60% versus SSO’s 0.91%, though it has lower liquidity and trading volume. SPUU's one-year return of 43.25% slightly outperforms SSO, showcasing its efficiency and cost advantage. The ETF's top holdings, including Microsoft, NVIDIA, and Apple, significantly drive its performance, particularly during strong earnings periods for these tech giants.
Overall, SPUU's leveraged exposure to the S&P 500 provides substantial upside potential in bullish markets, making it an attractive option for investors seeking amplified returns. However, the inherent risks and volatility associated with leveraged ETFs necessitate careful consideration and vigilant monitoring of economic indicators and market conditions.
That's TradingNEWS
Read More
-
SCHG ETF Near $33 High As AI Giants Drive 19% 2025 Rally
01.01.2026 · TradingNEWS ArchiveStocks
-
XRP-USD Stuck At $1.87 As XRPI Near $10.57 And XRPR Around $14.98 Despite $1.16B ETF Wave
01.01.2026 · TradingNEWS ArchiveCrypto
-
Natural Gas Price Forecast - NG=F Slides Toward Key $3.57 Support As Ng=F Extends 33% Drop
01.01.2026 · TradingNEWS ArchiveCommodities
-
USD/JPY Price Forecast - Yen Near 156 As Fed Cuts Meet Boj Hawkish Turn
01.01.2026 · TradingNEWS ArchiveForex