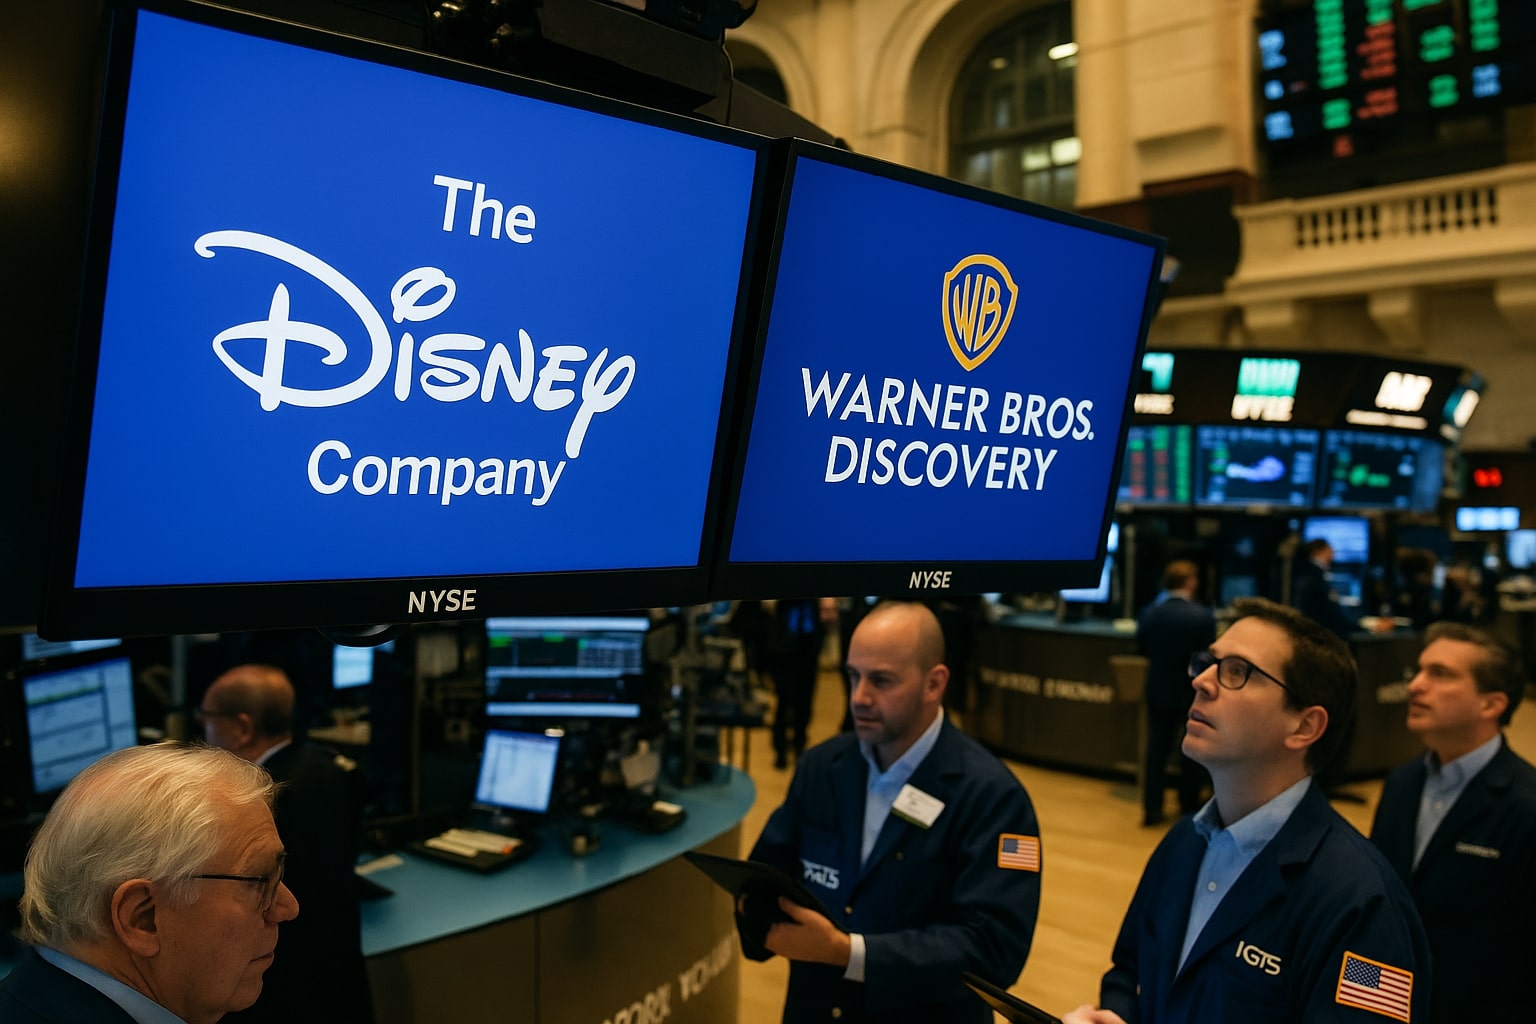
Disney Stock (NYSE:DIS) vs Warner Bros Stock (NASDAQ:WBD): Entertainment Stocks Diverge
Disney’s scale, profits, and parks fuel upside, while WBD’s stock surge rests on debt-heavy turnaround bets and Paramount takeover rumors | That's TradingNEWS
Disney (NYSE:DIS) vs Warner Bros Discovery (NASDAQ:WBD): Two Diverging Entertainment Giants
Disney (NYSE:DIS) and Warner Bros Discovery (NASDAQ:WBD) are both core players in the global entertainment industry, but their stock trajectories and financial positioning show sharp contrasts. Disney closed on September 12 at $115.96, with a $208.5B market cap, while Warner Bros Discovery finished at $18.87, commanding a $46.7B valuation. Over the past year, Disney shares have gained 30.9%, while WBD has surged 146%, making it one of the top-performing media stocks in 2025. The comparison highlights two very different stories: Disney as a legacy player regaining profitability across streaming and parks, versus WBD as a leveraged turnaround play driven by separation plans and takeover speculation.
Revenue and Earnings Growth Divergence
Disney reported $94.5B TTM revenue with $11.55B in net income and diluted EPS of $6.38, representing a margin of 12.2%. Warner Bros Discovery, by contrast, delivered $38.4B TTM revenue but only $0.31 EPS, with its bottom line constrained by a heavy debt load. WBD’s adjusted EBITDA for H1 2025 was $4.05B, while Disney’s EBITDA stood at $19.5B. The scale advantage is clear: Disney generates five times more revenue and EBITDA, with higher margins, while WBD relies on structural changes to unlock value.
Streaming: Profitability vs Growth Potential
Disney’s direct-to-consumer division has become profitable, producing $346M operating income in Q3 2025 after years of losses. Management guides for $1.3B in streaming operating income for 2025, supported by 183M combined Hulu/Disney+ subscribers and ARPU improvements. The upcoming ESPN standalone app at $29.99/month is expected to further lift ARPU and retention.
WBD’s streaming unit (Max) is also profitable, posting $293M EBITDA in Q2 2025, with subscribers climbing to 125.7M. ARPU slipped to $7.14 (down 10.7% YoY) but advertising revenue grew nearly 19% sequentially, offsetting the pressure. WBD’s streaming growth depends heavily on cost control and bundling, while Disney has the scale and global sports content to drive sustained profitability.
Read More
-
SCHG ETF Near $33 High As AI Giants Drive 19% 2025 Rally
01.01.2026 · TradingNEWS ArchiveStocks
-
XRP-USD Stuck At $1.87 As XRPI Near $10.57 And XRPR Around $14.98 Despite $1.16B ETF Wave
01.01.2026 · TradingNEWS ArchiveCrypto
-
Natural Gas Price Forecast - NG=F Slides Toward Key $3.57 Support As Ng=F Extends 33% Drop
01.01.2026 · TradingNEWS ArchiveCommodities
-
USD/JPY Price Forecast - Yen Near 156 As Fed Cuts Meet Boj Hawkish Turn
01.01.2026 · TradingNEWS ArchiveForex
Parks, Experiences, and Expansion vs Debt Constraints
Disney’s Parks and Experiences segment remains a powerhouse, with domestic parks operating income rising 22% YoY. The cruise line fleet expansion and the upcoming Abu Dhabi theme park—its first new park in 15 years—underscore Disney’s global growth strategy. Operating cash flow of $19.15B TTM gives Disney room to fund expansion while still returning cash to shareholders via dividends.
Warner Bros Discovery, in contrast, is constrained by $34.6B in debt and a net leverage ratio near 93% of equity. Free cash flow in H1 fell to $1B, down 26% YoY, as debt servicing costs dominate capital allocation. Its separation plan—splitting declining linear TV from streaming and studios—may unlock value but carries execution and regulatory risks.
Valuation Gap and Market Sentiment
Disney trades at a P/E of 18.18, forward P/E of 18.05, and EV/EBITDA of 13.6x. Its PEG ratio of 0.91 shows earnings growth is undervalued relative to expansion. WBD trades near 7.3x EV/EBITDA, a deep discount to streaming peers like Netflix (30x+), reflecting both upside potential if the split succeeds and heavy downside if execution falters. Analysts’ average price target for Disney is $132.23, while for WBD, consensus targets hover around $21–$23, aligned with its potential breakup value.
Takeover Speculation vs Steady Execution
Disney’s narrative revolves around steady execution—EPS beats, streaming profitability, and expanding global footprint. WBD’s story is dominated by M&A rumors. Reports of a potential Paramount Skydance (NASDAQ:PSKY) majority-cash bid sent WBD soaring +29% intraday on September 11. But such a deal would require assuming WBD’s $35B debt and clearing heavy regulatory hurdles, making it uncertain. Without a bid, WBD relies on its 2026 separation plan for rerating.
Insider and Institutional Dynamics
Disney insiders own just 0.07%, with institutions controlling 74.3% of the float. Tracking executive decisions via insider transactions will be critical as Bob Iger pushes forward with ESPN and content revivals. WBD insiders hold about 6%, with institutions at 73%. Shareholder focus remains on CEO David Zaslav, whose $63.5M compensation has drawn backlash even as he extended his contract through 2030. The tension reflects market skepticism over governance despite WBD’s stock rally.
Buy, Sell, or Hold Verdict: NYSE:DIS vs NASDAQ:WBD
Disney (NYSE:DIS), with scale, profitability, and a PEG below 1.0, offers a balanced growth-at-a-reasonable-price play. It is a Buy at $115.96 with upside into the $130–$140 range as streaming and parks fuel growth. Warner Bros Discovery (NASDAQ:WBD) at $18.87 remains a high-risk, high-reward turnaround. Its upside depends on a successful split or a buyout bid, but its $35B debt burden and regulatory headwinds temper enthusiasm. On fundamentals alone, WBD is a Hold, attractive only for speculative investors betting on corporate action.