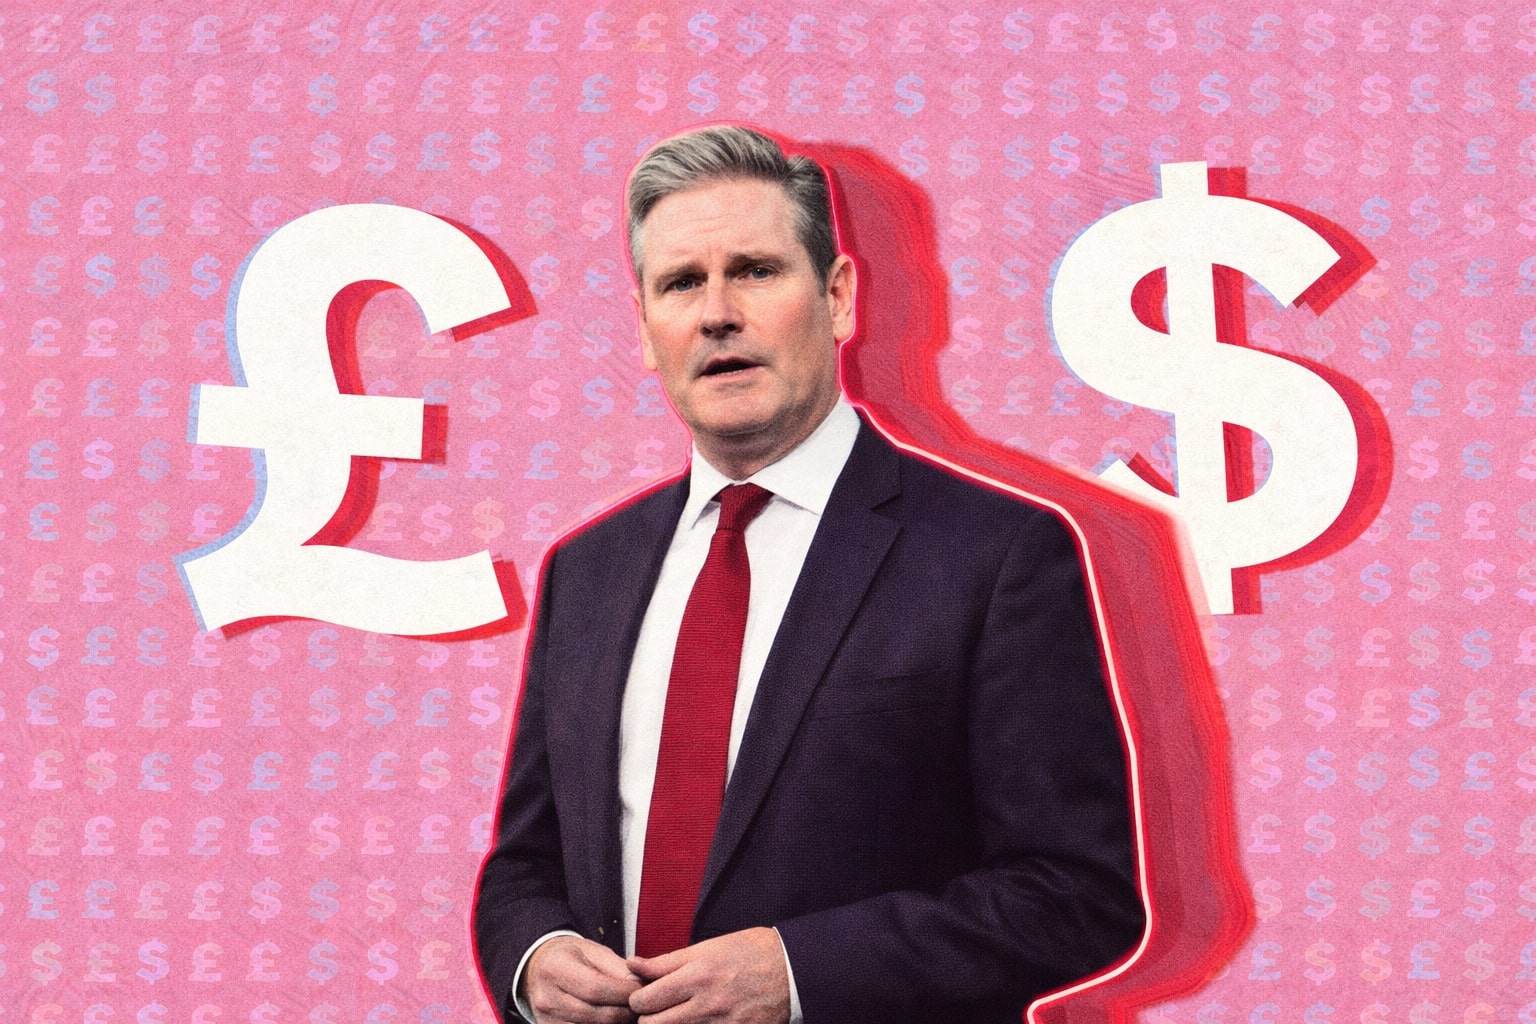
GBP/USD Crashes Below Key Trendline as Dollar Strength Triggers Breakdown
Cable plunges to 1.3390 with downside risk to 1.3142 as U.S. inflation lifts yields and BoE shifts dovish; support levels collapse | That's TradingNEWS
GBP/USD Cracks Support as Dollar Strength and CPI Divergence Trigger Trend Reversal
The British pound has unraveled into a full-blown technical breakdown against the U.S. dollar, with GBP/USD breaching multiple support levels and slicing through its 2025 uptrend. From a July 1 high of 1.3790, the pair has fallen over 3%, currently stabilizing near 1.3390, its weakest level in over three weeks. A culmination of macro and technical forces is driving the deterioration, led by rising U.S. Treasury yields, sticky U.S. inflation, fading BoE hawkishness, and risk-off flows accelerating the flight into the dollar.
U.S. CPI and Yield Spreads Flip Dollar Sentiment as GBP Lags
The catalyst for the recent selloff is the surprise uptick in U.S. inflation data. Headline CPI accelerated from 2.4% to 2.7% YoY, while core CPI moved up to 2.9%, exceeding estimates. Markets responded by pushing 2-year Treasury yields sharply higher, triggering a powerful USD rally. The U.S.-U.K. yield spread correlations are now decisively aligned against GBP/USD: the 20-day correlation with U.S. 2-year yields sits at -0.85, while the U.S. 10-year shows an even stronger inverse correlation at -0.88. In parallel, the dollar index (DXY) surged past 99, bolstering broad dollar demand and pressuring cable lower.
Sterling’s Technical Structure Collapses as Price Breaks 50-Day EMA
From a technical lens, GBP/USD is now entrenched in a bearish trend. It has failed to hold above 1.3430, the neckline of a prior cup-and-handle breakout. The loss of the ascending trendline from June confirms trend exhaustion. The 50-day EMA, previously a bounce zone, was sliced through with momentum. Current price trades below all major short-term moving averages, with the 14-day RSI rolling over and the MACD histogram firmly in negative territory. This opens downside risk toward the 1.3300 and 1.3250 regions, with the 1.3142 zone as the next major support cluster if sellers maintain control.
UK CPI Beats Estimates But BoE Dovish Lean Undercuts Sterling Reaction
Even a hotter-than-expected UK CPI print failed to arrest GBP downside. June inflation clocked in at 3.6% YoY, versus consensus at 3.4%, and core CPI hit 3.7%, above forecasts of 3.5%. However, the reaction in the pound was muted as traders remain focused on forward guidance. The Bank of England has already delivered two rate cuts in 2025, and market participants now price in another reduction at the next policy meeting. BoE Governor Andrew Bailey, in a recent speech, highlighted systemic risks stemming from global trade realignment and downplayed inflation threats, reinforcing dovish expectations.
Trump Tariff Threats and Risk-Off Sentiment Feed Dollar Demand
Further weighing on the pound is a broader shift in global sentiment. President Trump’s renewed tariff escalation strategy, including proposed 30% import duties on EU goods and "very severe" penalties against Russia, has stoked fears of retaliatory trade shocks. Markets are entering defensive mode, shunning risk currencies like GBP. Equities are wobbly, and the macro backdrop now favors the dollar as a relative safe haven. This is exacerbating the pressure on GBP/USD, with volatility rising and traders repositioning portfolios for slower global growth and tighter U.S. policy.
Pound Weakens Despite Elevated UK Inflation Expectations
Normally, hot inflation data might lift sterling on the premise of tighter BoE policy. However, this cycle is different. UK inflation is being met with skepticism on the policy front. While UK core CPI sits at 3.7%, the narrative is dominated by weak UK GDP figures and dovish central bank tone. As such, even elevated inflation is failing to inspire long positioning. The market perceives UK inflation as structurally transitory, particularly in the face of slowing household demand and Brexit-induced productivity drag.
Technicals Confirm Downtrend With No Strong Support Until 1.3140s
Momentum indicators and price structure align with continued downside. After losing the 1.3400 handle, cable has no firm support until 1.3250, a zone aligned with April lows and a key Fibonacci retracement. Below that, 1.3142 marks a psychological and structural level, near the 38.2% retracement of the 2025 move and close to the 52-week moving average, currently near 1.2980. Resistance now stands at 1.3430, while upside rejection is likely near the 50-day EMA around 1.3530.
Market Positioning and Forward Guidance Anchor GBP/USD Lower
Sentiment remains heavy as traders anticipate incoming U.S. PPI and industrial production data. Fed officials, including Beth Hammack, Lorie Logan, and Michael Barr, have all emphasized a “higher for longer” policy path, diminishing hopes for cuts in 2025. GBP/USD’s next directional cue may emerge from these events, but positioning suggests limited upside given the current rate divergence and policy bias. If the UK PPI and inflation data continue to diverge from the BoE’s dovish trajectory, the currency may remain under broad selling pressure.
GBP/USD Outlook: Bearish Structure Intact Unless Bulls Reclaim 1.3530
With trendlines broken, EMAs rolled over, and yield spreads favoring the dollar, GBP/USD remains structurally weak. Only a reclaim of 1.3530 would challenge the current bearish thesis. As of now, downside targets of 1.3250 and 1.3142 are active and credible, particularly if U.S. macro data continues to surprise to the upside and BoE remains on a path toward additional easing.
Verdict: Bearish – GBP/USD likely tests 1.3140 in coming sessions unless BoE surprises or U.S. data sharply deteriorates. Not a buy. Maintain short bias with stops above 1.3530.
That's TradingNEWS
Read More
-
SCHD ETF: $28.41 Price, 3.67% Yield And The Real Story After Broadcom’s Exit
12.01.2026 · TradingNEWS ArchiveStocks
-
XRP ETFs XRPI At $11.95 And XRPR At $16.98 While $750M Flees Bitcoin And Ether Funds
12.01.2026 · TradingNEWS ArchiveCrypto
-
Natural Gas Price Forecast: NG=F Snaps Back from $3.17 Lows as UNG and BOIL Surge
12.01.2026 · TradingNEWS ArchiveCommodities
-
USD/JPY Price Forecast - USDJPY=X Stalls Just Under 158 While Markets Game a Break or Reversal Near 160
12.01.2026 · TradingNEWS ArchiveForex