Gold Price Analysis: Current Trends and Technical Indicators
Examining Market Sentiment, Central Bank Actions, and Key Support and Resistance Levels for Gold | That's TradingNEWS
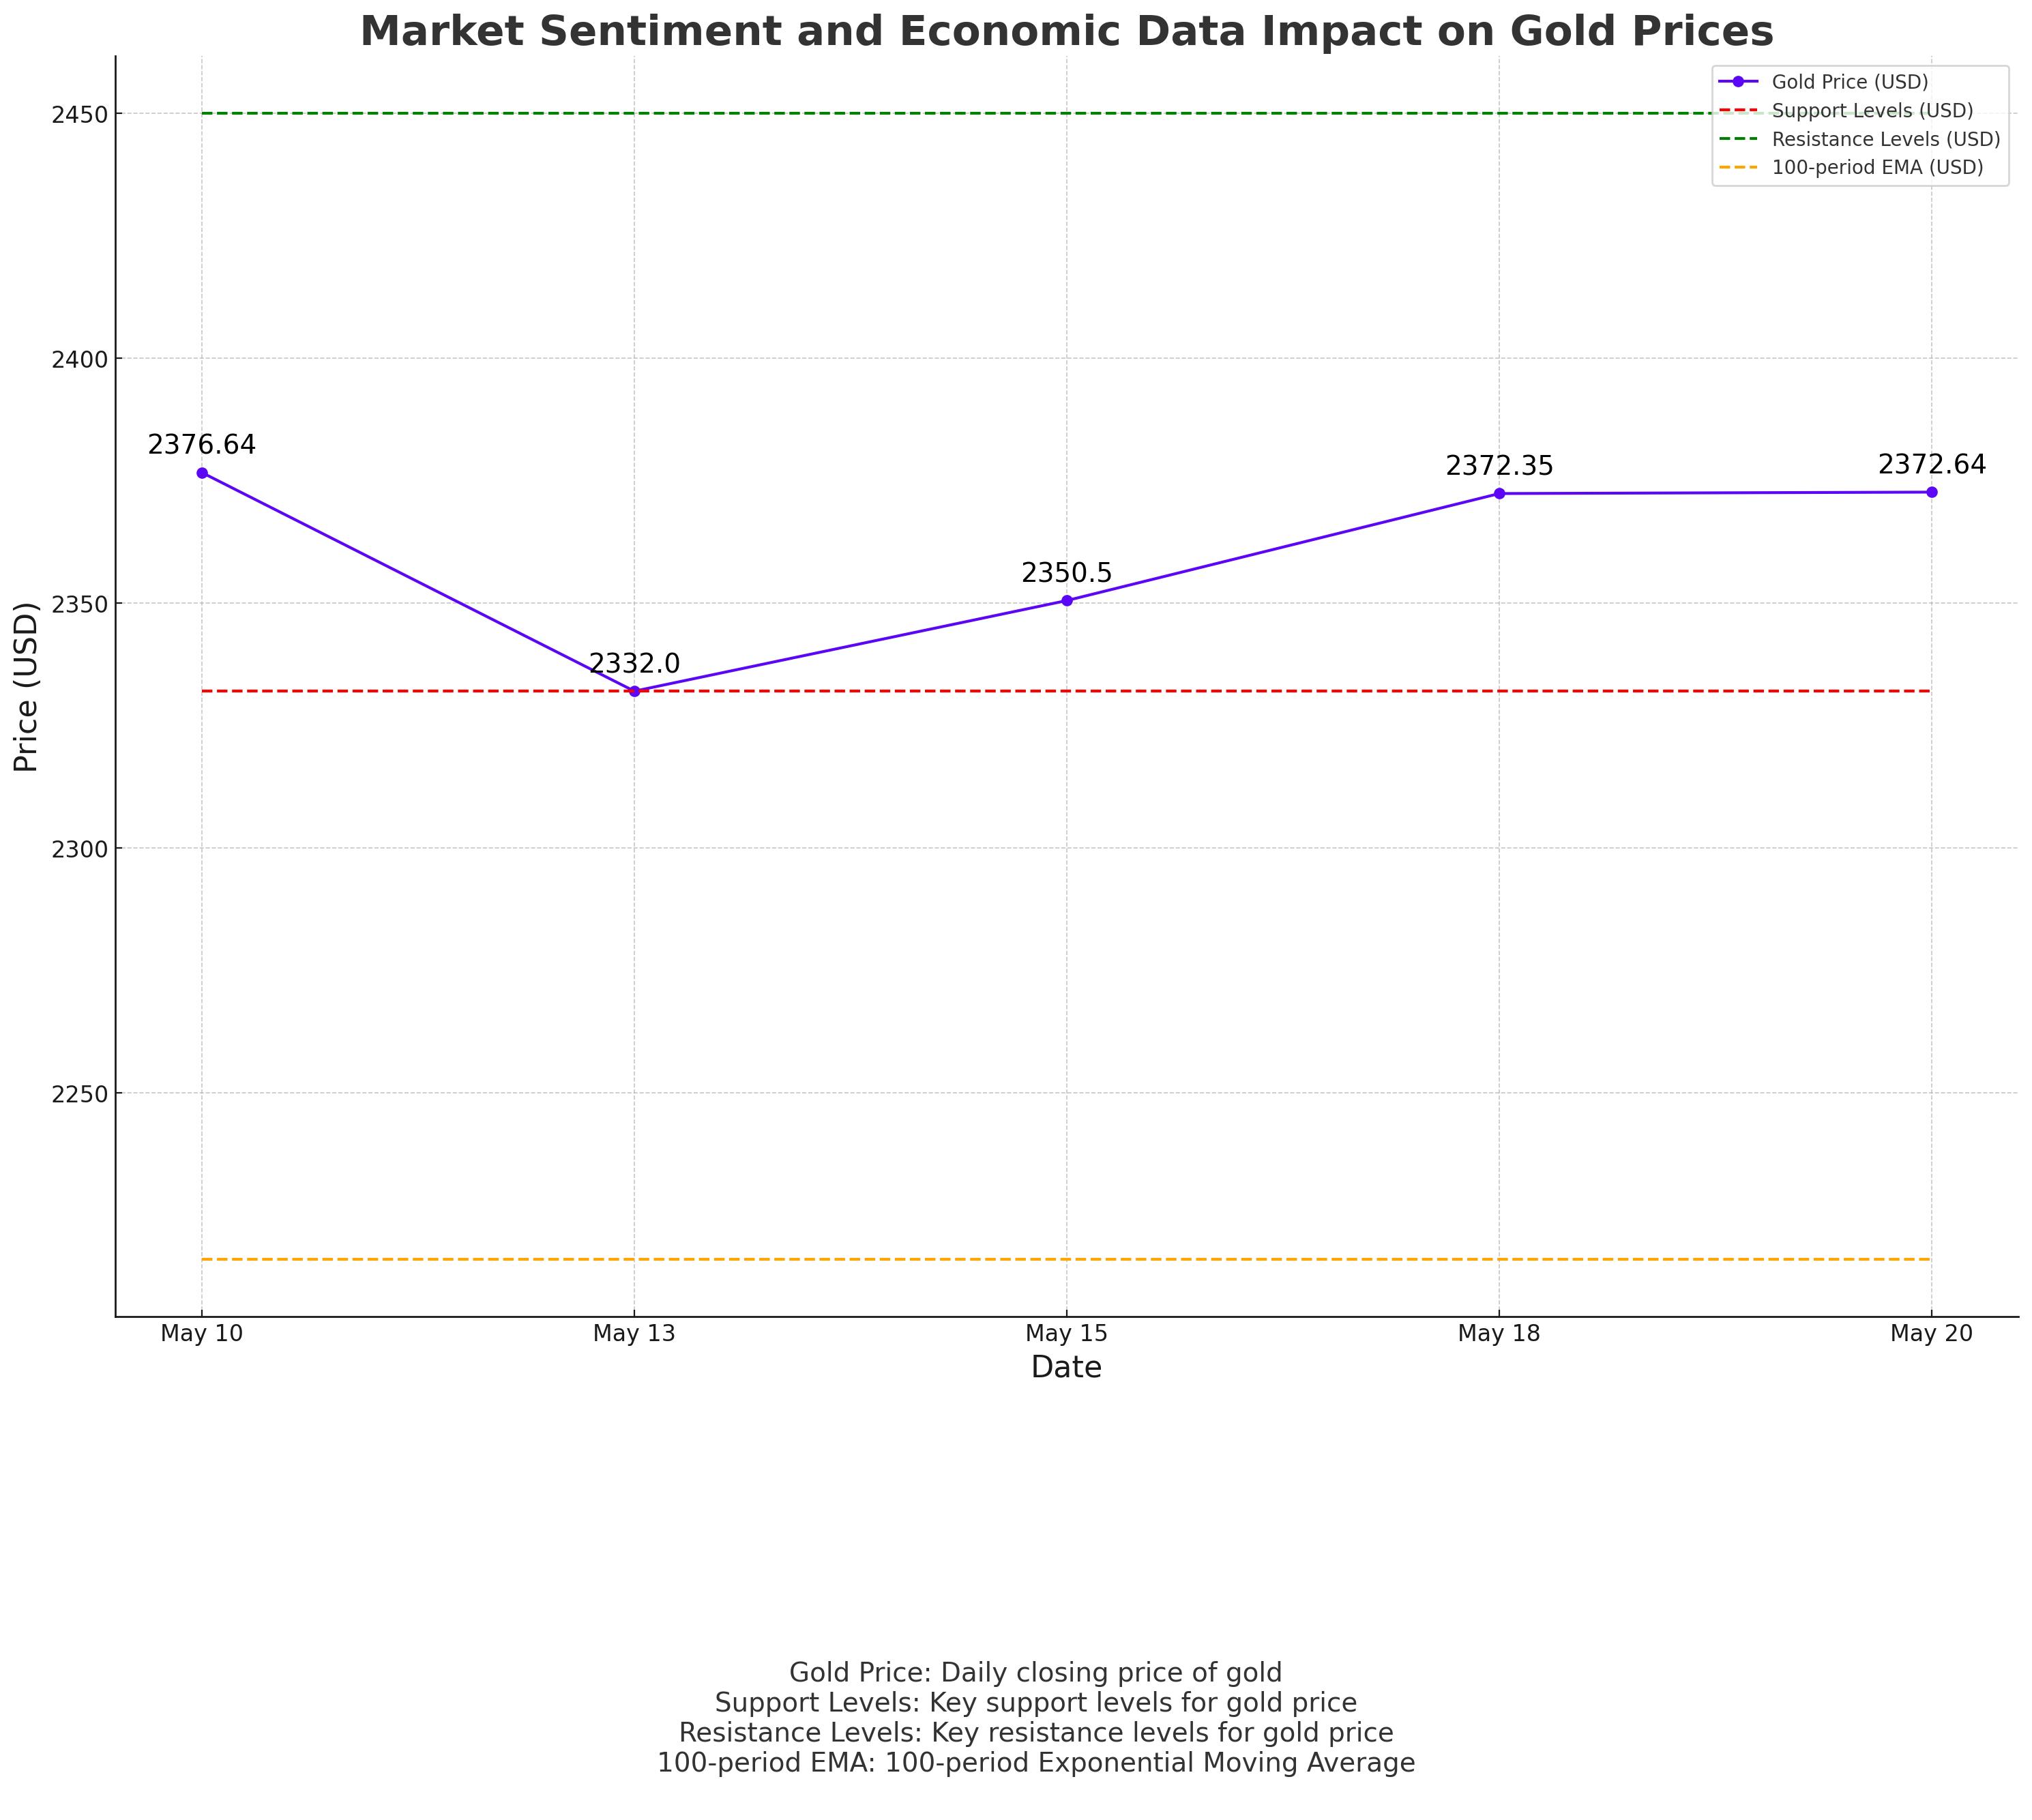
Market Sentiment and Economic Data Impact on Gold Prices
Gold prices are currently experiencing a bearish trend, influenced by the hawkish stance of the Federal Open Market Committee (FOMC) as detailed in their recent meeting minutes. These minutes indicated that while inflation has eased over the past year, there has been little progress towards the Fed's 2% inflation target. This has bolstered the US dollar, exerting selling pressure on gold.
Traders are now focused on upcoming US economic data, including the preliminary May readings of the Manufacturing and Services Purchasing Managers Indexes (PMIs). Weaker data could reignite hopes for Fed rate cuts, potentially supporting gold prices. Additionally, the Chicago Fed National Activity Index, weekly Initial Jobless Claims, and New Home Sales data are critical points of interest for market participants.
Global Central Bank Actions and Gold Demand
The People's Bank of China (PBoC) has emerged as the largest buyer of gold among global central banks, adding 225 tonnes to its reserves last year, marking the highest annual purchase since 1977. This significant accumulation underscores ongoing geopolitical and economic uncertainties, which continue to support gold prices.
In the broader context, central bank purchases and robust demand from Asia, particularly China, play a pivotal role in supporting gold prices. The recent rally in gold, which saw prices reaching new highs, is partly attributed to these factors.
Technical Analysis: Key Support and Resistance Levels
Gold (XAU/USD) is trading at $2,372.64, down 0.33%. The technical outlook remains bullish despite the recent price softness. The yellow metal is trading above the key 100-period Exponential Moving Average (EMA) on the daily timeframe. The 14-day Relative Strength Index (RSI) stands at 56.10, supporting buyers for now. However, a bearish divergence has formed, suggesting potential for a near-term correction or consolidation.
Key resistance levels are at the upper boundary of the Bollinger Band and the all-time high of $2,450. A break above this level could push prices towards the psychological mark of $2,500. On the downside, initial support is found at the low of May 13, around $2,332, with additional support at the lower limit of the Bollinger Band at $2,270. Breaching these levels could see a drop to the 100-period EMA at $2,216.
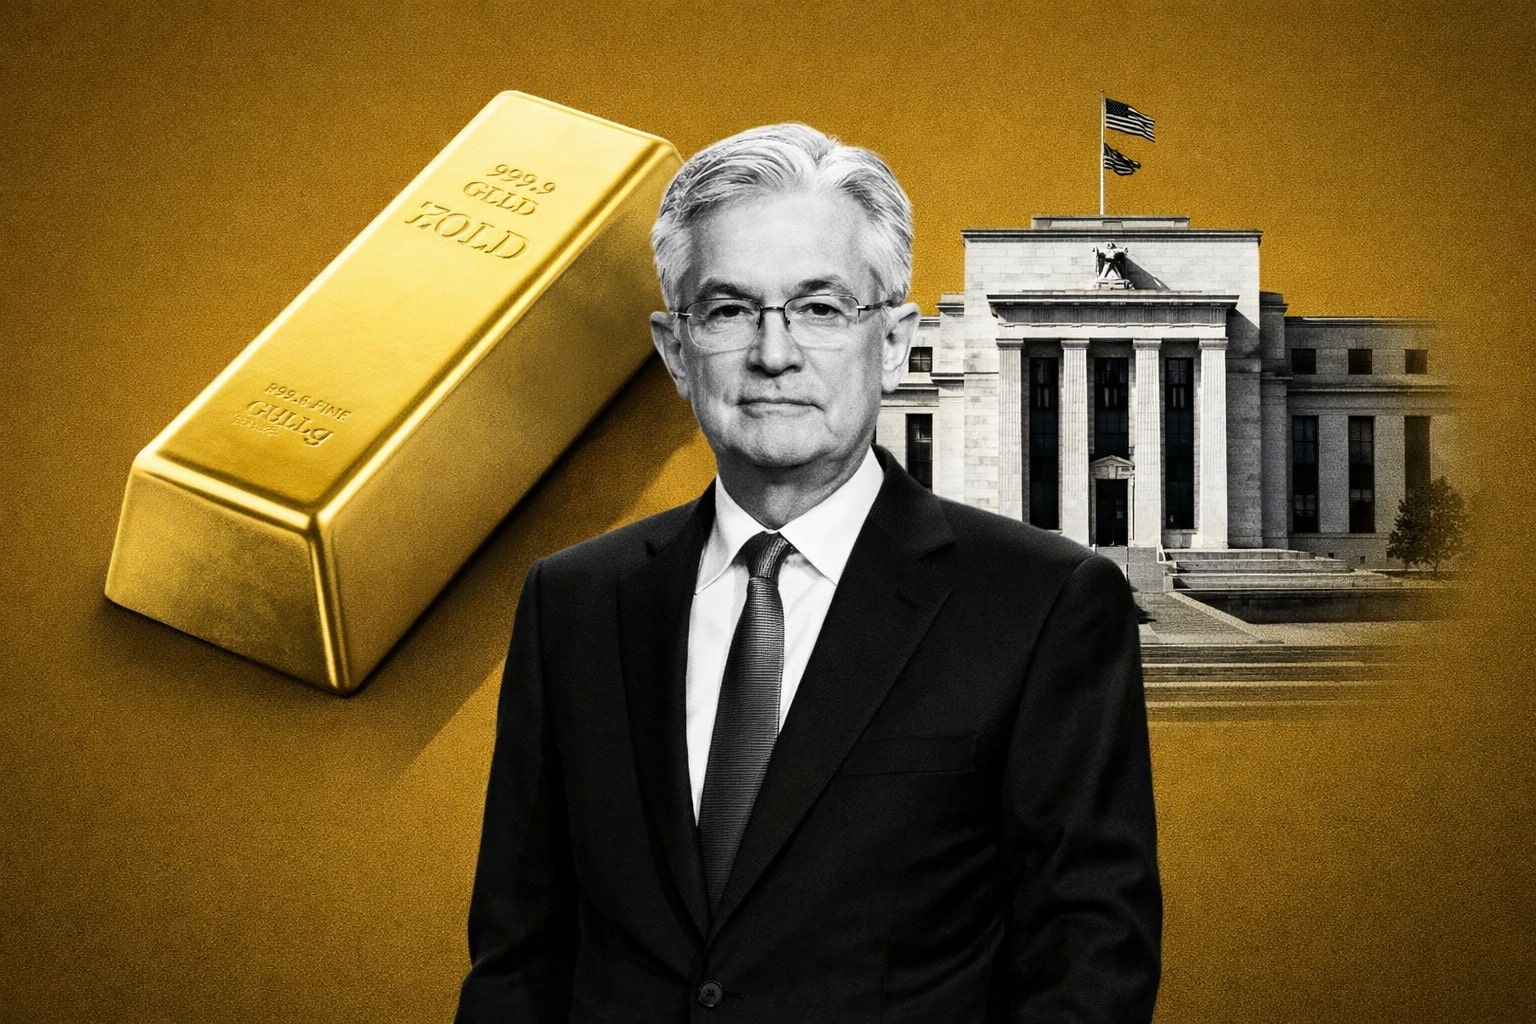
Impact of Federal Reserve Policy on Gold Prices
The FOMC minutes released on Wednesday highlighted a more hawkish stance, indicating a likelihood of maintaining high interest rates for longer to curb inflation. This has strengthened the US dollar, placing additional downward pressure on gold prices. Investors have priced in a nearly 60% chance of the first rate cut happening in September, with two quarter-point reductions anticipated by year-end, according to the CME FedWatch Tool.
Geopolitical Tensions and Their Influence on Gold
Geopolitical tensions continue to provide underlying support for gold prices. Recent events, such as the death of Iran’s President Ebrahim Raisi in a helicopter crash and increased tensions in the Middle East, contribute to the safe-haven demand for gold. Additionally, geopolitical risks and central bank activities, including significant purchases by China, are critical factors influencing gold prices.
Future Price Projections and Market Dynamics
Gold prices are currently trading near key resistance and support levels. Immediate resistance is seen at $2,396.72, with further resistance at $2,416.82 and $2,433.83. Support levels are at $2,372.35, $2,351.86, and $2,332.14. The RSI at 35.45 indicates bearish momentum, and the 50 EMA at $2,388.31 provides dynamic resistance.
Analysts predict that a sustained break above $2,400 could lead to new highs, while a fall below $2,300 could signal further declines. The market remains sensitive to US economic data and geopolitical developments, which will likely dictate short-term movements.
Future Outlook: Positive Trajectory for Gold
Despite recent price fluctuations, the long-term outlook for gold remains positive, driven by strong technical indicators and significant central bank purchases. The metal's key support levels and ongoing geopolitical tensions create a stable foundation for potential price appreciation. Notably, gold is trading above the 100-period EMA, and the RSI holds above 56. Additionally, China's record addition of 225 tonnes to its reserves in 2023 underscores ongoing demand. Investors should monitor economic data releases and geopolitical developments, as these will crucially shape gold's future price trajectory.
That's TradingNEWS
Read More
-
GPIX ETF 8% Monthly Yield and S&P 500 Upside at $53
13.01.2026 · TradingNEWS ArchiveStocks
-
XRP ETFs XRPI, XRPR and Bitwise XRP Pull In $1.5B as XRP-USD Stalls Around $2.13
13.01.2026 · TradingNEWS ArchiveCrypto
-
Natural Gas Price Forecast: NG=F Climbs Off $3.00 Floor as Cold Snap and LNG Flows Lift UNG
13.01.2026 · TradingNEWS ArchiveCommodities
-
USD/JPY Price Forecast - USDJPY=X Charges Toward ¥159 as Japan Election Fears Hit the Yen
13.01.2026 · TradingNEWS ArchiveForex