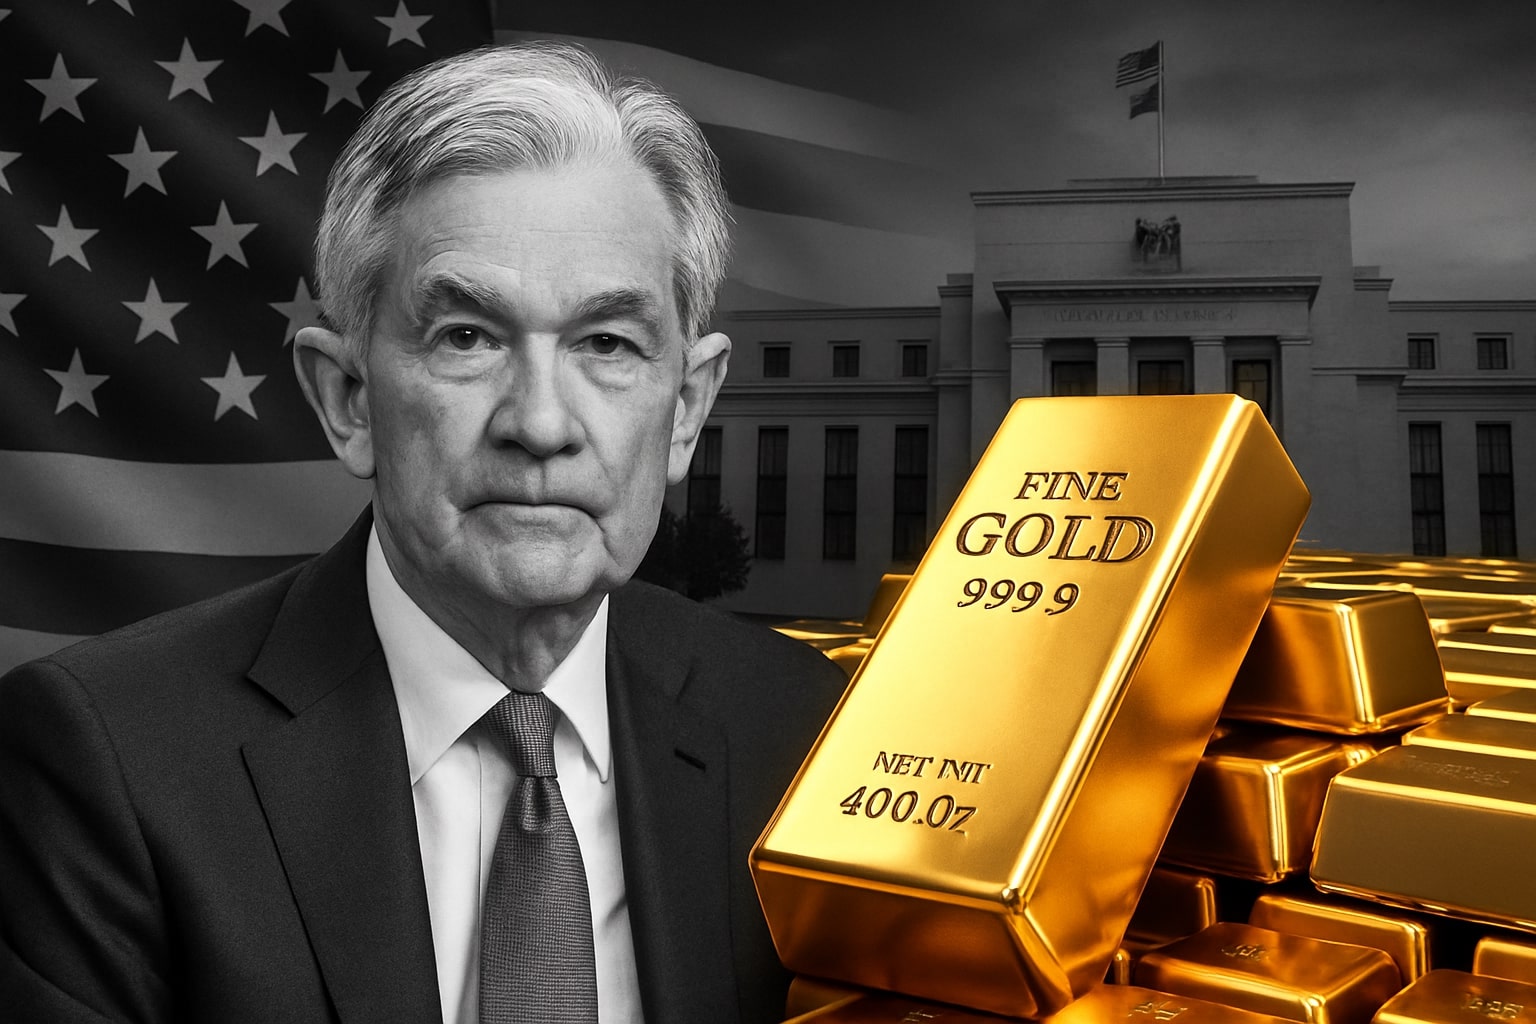
Gold Price Forecast - XAU/USD Extends Rally Above $4,130 as Fed Rate Cut Bets Strengthen and Central Banks Boost Demand
Gold rallies toward $4,245 amid dovish Fed rhetoric, weaker Treasury yields, and record central-bank buying, reinforcing its global safe-haven dominance | That's TradingNEWS
Gold (XAU/USD) Reclaims $4,100 as Dovish Fed Rhetoric and Global Uncertainty Drive Renewed Bullish Momentum
The price of gold (XAU/USD) is consolidating above $4,130 per ounce, extending its rally from the November low near $4,000 as expectations of imminent Federal Reserve rate cuts, a softening U.S. dollar, and surging central-bank demand reinforce its position as the world’s dominant safe-haven asset. Despite light pre-holiday liquidity, the metal remains supported by a powerful alignment of macro and technical factors, with traders eyeing the critical $4,200–$4,245 resistance zone that defines the next leg of the long-term uptrend.
Federal Reserve Dovish Turn Ignites Gold’s Latest Upswing
The latest catalyst for gold’s rise came from dovish commentary by New York Fed President John Williams, who stated last Friday that the policy stance was “modestly restrictive” and hinted at a “further adjustment toward neutrality.” Those remarks, reinforced by Fed Governor Christopher Waller and Stephen Miran earlier this week, transformed market expectations. The CME FedWatch Tool now shows an 85% probability of a 25-basis-point rate cut in December, compared to just 30% last week, while a 64% probability is already priced for another cut in January.
That policy shift has pushed real yields lower, with the U.S. 10-year Treasury slipping to 4.02% and the 2-year yield to 3.48%, undercutting the dollar’s recent strength. The U.S. Dollar Index (DXY) fell 0.32% to 97.24, loosening its grip after touching a three-month high, and enabling gold to advance even as the greenback remains relatively firm. Lower yields diminish the opportunity cost of holding non-yielding assets like gold, a relationship that has historically amplified every easing cycle since 2008.
Government Shutdown and Data Delays Add to Safe-Haven Demand
The ongoing U.S. government shutdown—now stretching beyond six weeks—has disrupted critical economic reporting and injected uncertainty into the policy narrative. With delayed inflation, employment, and spending data, policymakers and investors alike have lost visibility into near-term trends, pushing more capital toward defensive stores of value. This breakdown in traditional data flow has made gold one of the few assets reflecting consensus expectations, as traders use it to price in future instability.
The shutdown’s indirect impact on the Producer Price Index (PPI) and retail sales reports—both weaker than projected—further fueled the metal’s momentum. Retail sales rose just 0.2% month-over-month, missing the 0.4% estimate, while the PPI rose 2.7% year-over-year, unchanged from August. These figures confirm slowing consumption and cooling inflation pressures, reinforcing the case for the Fed’s imminent shift to rate normalization.
Central Banks Deepen Accumulation Amid Currency Fragility
Central-bank gold purchases remain one of the most powerful undercurrents in this cycle. Institutions across Asia and the Middle East have accelerated accumulation as part of de-dollarization strategies. The People’s Bank of China, Reserve Bank of India, and Central Bank of Turkey have collectively purchased over 1,200 metric tons in 2025—an estimated 28% increase from the prior year. These inflows have tightened global physical supply and elevated the long-term floor for XAU/USD pricing above $3,900, as every dip attracts sovereign demand.
This sustained buying aligns with Bloomberg’s commodity index data showing that gold has outperformed all major metals year-to-date, rising 21.8% compared to silver’s 14.6% and copper’s 9.2%. The World Gold Council estimates that central-bank demand now represents nearly 25% of total annual gold consumption, compared with 11% a decade ago—a structural shift transforming gold into a quasi-monetary hedge rather than a speculative commodity.
Technical Landscape: $4,100 Support and $4,245 Resistance Define the Range
From a technical standpoint, gold (XAU/USD) maintains a strong bullish structure. After bouncing from the 78.6% Fibonacci retracement near $4,000, the metal reclaimed its 20-day moving average at $4,056, turning it into immediate support. The 50-day moving average, now aligned at $3,999, remains the key defensive pivot. As long as gold holds above this level, momentum remains in favor of buyers.
The intraday Relative Strength Index (RSI) on the 4-hour chart consolidates near 61, suggesting controlled bullish energy without entering overbought territory. The MACD histogram continues to print positive bars above the zero line, reinforcing momentum consistency. A decisive breakout above $4,150 would confirm that the correction from $4,250 has fully completed, setting up an advance toward the $4,210–$4,245 range, with an extended target near $4,381, the all-time high recorded earlier this year.
Should gold close below $4,100, a minor pullback toward $4,040–$4,020 could occur, followed by deeper support at $3,889, where buying historically re-emerges. A close below $3,999 would invalidate the short-term bullish structure and open the door to a test of $3,850, though that remains unlikely under the current monetary trajectory.
Macro Divergence Between Gold and the Dollar Strength Index (DXY)
Unlike previous cycles, gold has managed to rally despite intermittent dollar strength—a phenomenon tied to shared safe-haven flows. The DXY’s late-November rebound to 97.80 did not reverse gold’s trajectory, underscoring how traders now view both as hedges against policy uncertainty rather than opposites in a linear relationship. This dynamic was visible in the first half of November when both gold and the dollar rose simultaneously—a rare correlation seen only during liquidity shocks or high-volatility macro events.
While gold’s traditional inverse correlation with DXY still holds over longer horizons (currently around -0.61 on a 90-day basis), short-term demand overlaps are common when both assets hedge geopolitical and fiscal stress simultaneously. As the dollar’s appeal as a sole safe-haven fades, gold’s role expands as the asset of choice for sovereign reserves and long-duration funds.
Geopolitical Tailwinds and Global Supply Constraints Reinforce the Bullish Case
Beyond U.S. macro policy, gold benefits from intensifying geopolitical risks. Tensions in the South China Sea, renewed trade friction between the U.S. and China over rare earth minerals, and the Ukraine peace process’s fragile implementation all add layers of uncertainty. Physical bullion premiums in Shanghai remain above $50 per ounce, signaling domestic demand outpacing supply amid import restrictions. In Bangkok, retail gold trades at 65,100 Thai baht per baht-weight, equivalent to roughly $1,997 USD per 15.244 grams, highlighting global price divergence due to localized demand pressure.
Meanwhile, declining output from key mining hubs in South Africa and Peru, down 3.6% and 4.1% year-over-year, respectively, compounds the supply crunch. The net result is a structurally tight physical market overlaying speculative momentum in futures—an environment that has historically preceded multi-month extensions of rallies.
Read More
-
SCHG ETF Near $33 High As AI Giants Drive 19% 2025 Rally
01.01.2026 · TradingNEWS ArchiveStocks
-
XRP-USD Stuck At $1.87 As XRPI Near $10.57 And XRPR Around $14.98 Despite $1.16B ETF Wave
01.01.2026 · TradingNEWS ArchiveCrypto
-
Natural Gas Price Forecast - NG=F Slides Toward Key $3.57 Support As Ng=F Extends 33% Drop
01.01.2026 · TradingNEWS ArchiveCommodities
-
USD/JPY Price Forecast - Yen Near 156 As Fed Cuts Meet Boj Hawkish Turn
01.01.2026 · TradingNEWS ArchiveForex
Futures Market Positioning and ETF Flows Confirm Renewed Institutional Interest
Institutional sentiment has improved markedly. The Commodity Futures Trading Commission (CFTC) reports that managed-money net long positions in COMEX gold futures rose to 247,000 contracts, up 11.4% week-over-week, marking the largest accumulation since August. In parallel, global gold ETFs recorded $1.2 billion in net inflows last week after three consecutive weeks of outflows, led by the SPDR Gold Shares (NYSEARCA:GLD) and iShares Gold Trust (NYSEARCA:IAU).
ETF investors are clearly repositioning ahead of the December FOMC meeting, seeking exposure to rate-sensitive assets. Combined with futures data, this flow dynamic suggests that fund managers are not just hedging portfolios—they are actively betting on a sustained structural breakout above $4,200 into Q1 2026.
Global Inflation Dynamics: The Hidden Catalyst Behind $4,100 Gold
While headline inflation has cooled, core inflation in advanced economies remains sticky. In the U.S., the core PCE index sits at 3.1% year-over-year, above the Fed’s target, while in the Eurozone, core CPI remains elevated at 2.9%. Persistent inflation, combined with limited policy flexibility, continues to erode real yields globally. This combination has historically underpinned gold’s strongest multiyear rallies—most notably between 2009 and 2011, and again in 2020–2021.
Moreover, monetary policy divergence among major central banks amplifies the appeal of holding gold as a cross-currency hedge. The Bank of Japan’s yield-curve control shift, the European Central Bank’s cautious stance, and the People’s Bank of China’s easing bias all contribute to a synchronized softening of global rates. Gold’s current trajectory, supported by a real-yield compression cycle, aligns with projections for $4,700–$4,900 per ounce by 2026, as estimated by institutional models including WisdomTree’s Nitesh Shah.
Forward Outlook and Key Levels to Monitor
The short-term trend for XAU/USD remains bullish above $4,100, with immediate resistance seen at $4,150 and $4,210, followed by a breakout zone at $4,245–$4,381. The $4,000–$3,999 corridor remains the critical line of defense for bulls. Price behavior around the December 10 Federal Reserve decision will likely determine whether gold extends to new all-time highs before year-end or enters a consolidation phase into Q1 2026.
Momentum indicators across daily and weekly frames favor continuation, with average true range (ATR) compression signaling stored volatility. If rate cuts materialize as expected, gold’s path to $4,381 could unfold within weeks rather than months.
Verdict: Gold (XAU/USD) — Strong Buy
Considering the convergence of dovish monetary policy, falling yields, central-bank accumulation, and technically confirmed support above $4,000, gold’s risk-reward profile remains decisively bullish. The current consolidation is corrective rather than distributive, and every dip toward $4,050–$4,000 continues to attract deep-pocketed institutional bids.
Gold (XAU/USD): Strong Buy, with short-term upside toward $4,245, medium-term target at $4,381, and 2026 projection range of $4,700–$4,900 under an extended Fed easing cycle. The structure of the rally remains intact, underpinned by fundamentals, central-bank flows, and tightening physical supply — making gold not just a hedge, but the dominant global asset in the transition from tightening to reflation.


