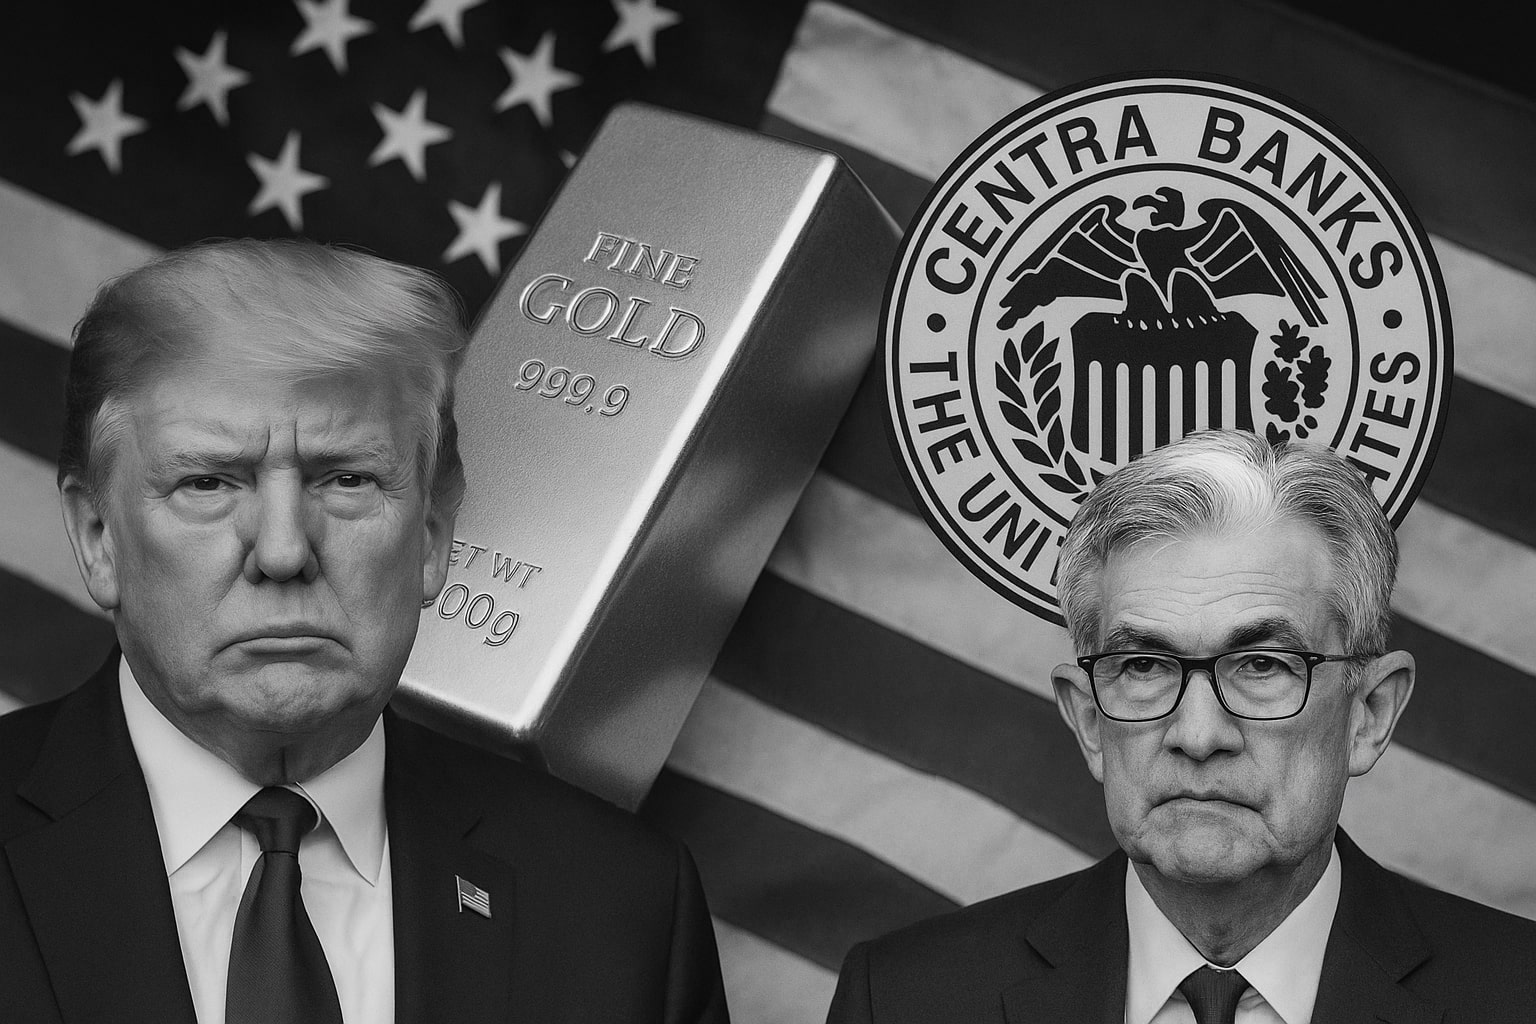
Gold Price Forecast - XAU/USD Pulls Back From Record $4,378 as Trump Calms Trade Fears
Spot gold slips to $4,220 after a 66% YTD surge, driven by record ETF demand, Fed cut expectations, and central-bank buying amid global market tension | That's TradingNEWS
Gold (XAU/USD) Retreats From Record Highs as Trade Calm, Blow-Off Top Warnings, and Fed Bets Reshape the Rally
Gold’s spectacular 2025 ascent momentarily stalled after touching unprecedented levels above $4,378 per ounce, as shifting global risk sentiment and the easing of U.S.–China tariff fears prompted investors to take profits. Spot XAU/USD fell as much as 2.2% to $4,220.10, while December futures on the Comex closed around $4,236.20, down 1.6% intraday. The correction came just hours after the metal had posted its biggest two-day climb since the financial crisis of 2008 and remains roughly 8% higher for the week, up 66% year-to-date, far outpacing other major asset classes.
Trump’s Trade Reversal Cools Panic Bids for Safe-Haven Metals
The pullback coincided with President Donald Trump’s reassurance that the planned 100% tariffs on Chinese imports “will not stand”, a statement that defused a surge of geopolitical anxiety responsible for gold’s latest record run. Earlier panic over escalating trade conflict had driven investors to abandon equities and pile into bullion, pushing spot prices from $4,214 to $4,314 per ounce intraday on October 16 before exhaustion set in. Equity indices rebounded once Trump confirmed that negotiations with Beijing would resume, paring risk-off flows and cooling the safe-haven rush that had characterized the week.
Wall Street’s earlier turbulence—sparked by a sell-off in regional U.S. bank stocks amid credit concerns—had briefly revived memories of 2008 and sent traders scrambling for protection. As sentiment normalized, gold’s defensive bid weakened, revealing just how leveraged speculative positioning had become after months of relentless inflows.
Record-Breaking Rally Fueled by Central Banks and ETF Demand
Behind the volatility lies a structural story of global reallocation. According to analysts at Société Générale, central bank accumulation and ETF inflows remain the dominant drivers of gold’s 2025 surge. “Resilient and huge ETF flows are pulling prices up,” said the bank’s commodity head Michael Haigh, whose team projects gold reaching $5,000 per ounce by 2026. HSBC raised its own 2025 average forecast by $100 to $3,455 per ounce, acknowledging that sovereign diversification and de-dollarization trends are accelerating.
The World Gold Council’s latest data shows ETF holdings at record levels, with institutional demand outpacing jewelry and industrial usage by more than 3:1. Investors are also betting on dovish monetary policy: Fed funds futures now imply two 25-basis-point cuts, one expected at the October 29–30 FOMC meeting and another in December, supporting non-yielding assets like gold against the weakening U.S. dollar (DXY 98.22).
Comex Surge to $4,280 Sets a New Historical Benchmark
Comex contracts settled 2.47% higher at $4,280.20 on October 16, cementing the highest close ever recorded for gold futures. The day’s range—$4,214.50 low to $4,314.50 high—reflected extreme intraday volatility as geopolitical headlines drove algorithmic flows. The year-on-year increase now exceeds 59%, a rally unmatched since the early 1970s gold-standard unraveling. Analysts attribute the rise to synchronized global uncertainty: trade disputes, slowing growth in China, and rising speculation of an end to the Federal Reserve’s tightening cycle.
Market veterans compared the move to the 2006 blow-off top pattern, where gold spiked 36% in two months before retracing 25% in four weeks. This analog has drawn technical warnings that the current advance may be unsustainable without a period of consolidation.
Technical Signals Flash Classic Blow-Off Top Warnings
Chart analysis reveals gold trading more than 75% above its 200-week moving average, a threshold historically associated with intermediate peaks. During prior bull cycles — 2006, 2008, and 2011 — similar extensions were followed by corrections of 20%–25% before the longer-term trend resumed. The latest move mirrors that geometry: prices overshooting the upper trendline near $4,400–$4,600 could precede a retracement toward $3,500, where the 200-day moving average now sits.
FXEmpire’s technical strategist A.G. Thorson notes that the parabolic nature of recent gains fits the textbook definition of a “blow-off top,” in which speculative euphoria and leverage push markets far beyond equilibrium. Still, he emphasizes that such corrections often mark healthy resets inside enduring secular uptrends. Should history rhyme with 2006, the next multi-month consolidation could set the stage for a longer-term rally toward $6,500 by 2027 and potentially $10,000 by 2030, consistent with expanding monetary debasement and record fiscal deficits.
Silver, Platinum, and Mining Stocks Reflect Parallel Extremes
Gold’s vertical climb has dragged the entire precious-metals complex higher. Silver (XAG/USD) broke through its 45-year cup-and-handle formation, touching $54.14 before pulling back. Adjusted for inflation, analysts see long-term fair value near $200, underpinned by solar-panel and AI-chip demand. Platinum (PL=F) hit a new peak above $1,800 and could retrace to $1,300 if gold corrects 20%.
Mining equities mirrored the metal’s advance. The VanEck Gold Miners ETF (NYSE: GDX) reached $85, fulfilling a four-year rounded-bottom target, while the Junior Miners ETF (NYSE: GDXJ) remains in a strong uptrend with an additional 5–10% upside possible if spot gold retests $4,400–$4,600. Silver-focused miners (NYSEARCA: SILJ) hit fresh highs as speculative capital flooded the sector. These valuations, however, are now tightly coupled to gold’s short-term path; any bullion retracement is likely to produce amplified percentage declines across mining shares.
Asian and Emerging-Market Buyers Add Support
In Asia, physical demand has re-emerged despite record prices. Philippine gold rose from ₱8,086.72 to ₱8,147.66 per gram on October 17, equivalent to ₱253,420.80 per troy ounce, illustrating how local markets are adjusting rapidly to global benchmarks. Similar strength is observed in India and Thailand, where jewelry purchases continue even at historically high levels due to cultural affinity and currency depreciation.
Meanwhile, Amaroq Minerals (CVE: AMRQ) announced the first sales of traceable Greenlandic gold, a milestone for ethical sourcing. Regional miners from Endeavour Silver (NYSE: EXK) to BHP Group (NYSE: BHP) are expanding exploration budgets in response to sustained profitability at current price levels. The Northern Miner Top-50 Index reported aggregate miner valuations surging $450 billion in a quarter, lifting the group’s combined capitalization near $2 trillion—the highest ever.
Macro Crosscurrents: Dollar Weakness and Policy Expectations
The macro backdrop continues to favor bullion structurally. The U.S. economy’s deceleration, coupled with a government shutdown and rising Treasury yields around 4.0%, has pushed investors toward real-asset hedges. Simultaneously, global central banks led by China, Turkey, and India have added more than 140 tons of gold to reserves in the last quarter, diversifying away from the dollar.
Traders increasingly view gold not merely as a crisis hedge but as a strategic allocation amid de-globalization and the fracturing of trade systems. Trump’s easing rhetoric provided short-term relief to risk assets, yet the longer-term implications—volatile trade policy and potential sanctions cycles—continue to underpin the metal’s appeal.
Read More
-
PFFA ETF: 9%+ Preferred Income ETF Holding Its Ground Near $22
24.01.2026 · TradingNEWS ArchiveStocks
-
XRP ETFs XRPI and XRPR Suffer First $40M Red Week as XRP Drops Back Toward $1.91
24.01.2026 · TradingNEWS ArchiveCrypto
-
Natural Gas Price Forecast - NG=F Jumps 70% To Five-Year High As Winter Storm Fern Slams US
24.01.2026 · TradingNEWS ArchiveCommodities
-
USD/JPY Price Forecast - USDJPY=X Crashes Below 157 as Intervention Risk and BoJ 0.75% Hit the Dollar
24.01.2026 · TradingNEWS ArchiveForex
Short-Term Risk of Correction Meets Long-Term Structural Bull Market
The near-term landscape points to heightened volatility. RSI readings above 80 on weekly charts confirm overbought conditions, while futures open interest suggests crowded speculative longs. Analysts expect consolidation between $4,100 and $4,400 before directionality returns. A failure to hold $4,200 could expose $3,850, followed by $3,500, while sustained closes above $4,450 would resume the parabolic extension.
Despite the risk of a 20% pullback, macro models built on real yields, Fed expectations, and liquidity trends maintain a bullish long-term slope. With global debt surpassing $340 trillion and fiscal policy increasingly expansionary, gold’s historical inverse correlation with real rates remains intact.
Trading News Verdict on Gold (XAU/USD)
XAU/USD – Rating: Hold / Long-Term Bullish.
The metal’s short-term tone is overextended, vulnerable to profit-taking toward $3,800–$3,500, but the structural forces of central-bank demand, ETF inflows, and geopolitical fragmentation justify higher medium-term targets. The market has likely entered a late-stage blow-off phase within a secular bull run that still points toward $5,000–$6,000 by 2026–2027. For disciplined investors, weakness remains an opportunity to accumulate, not capitulate.


