Gold's Assertive Return: A Deep Dive into Economic Factors
The ascendency of gold prices driven by economic concerns in China, US Treasury yield dynamics, and key resistance and support levels. How are the upcoming Jackson Hole Symposium and BRICS summit set to shape the gold market? | That's TradingNEWS
I. The Resurgence of Gold Prices
A. Economic Factors and the Appeal of Safe Havens
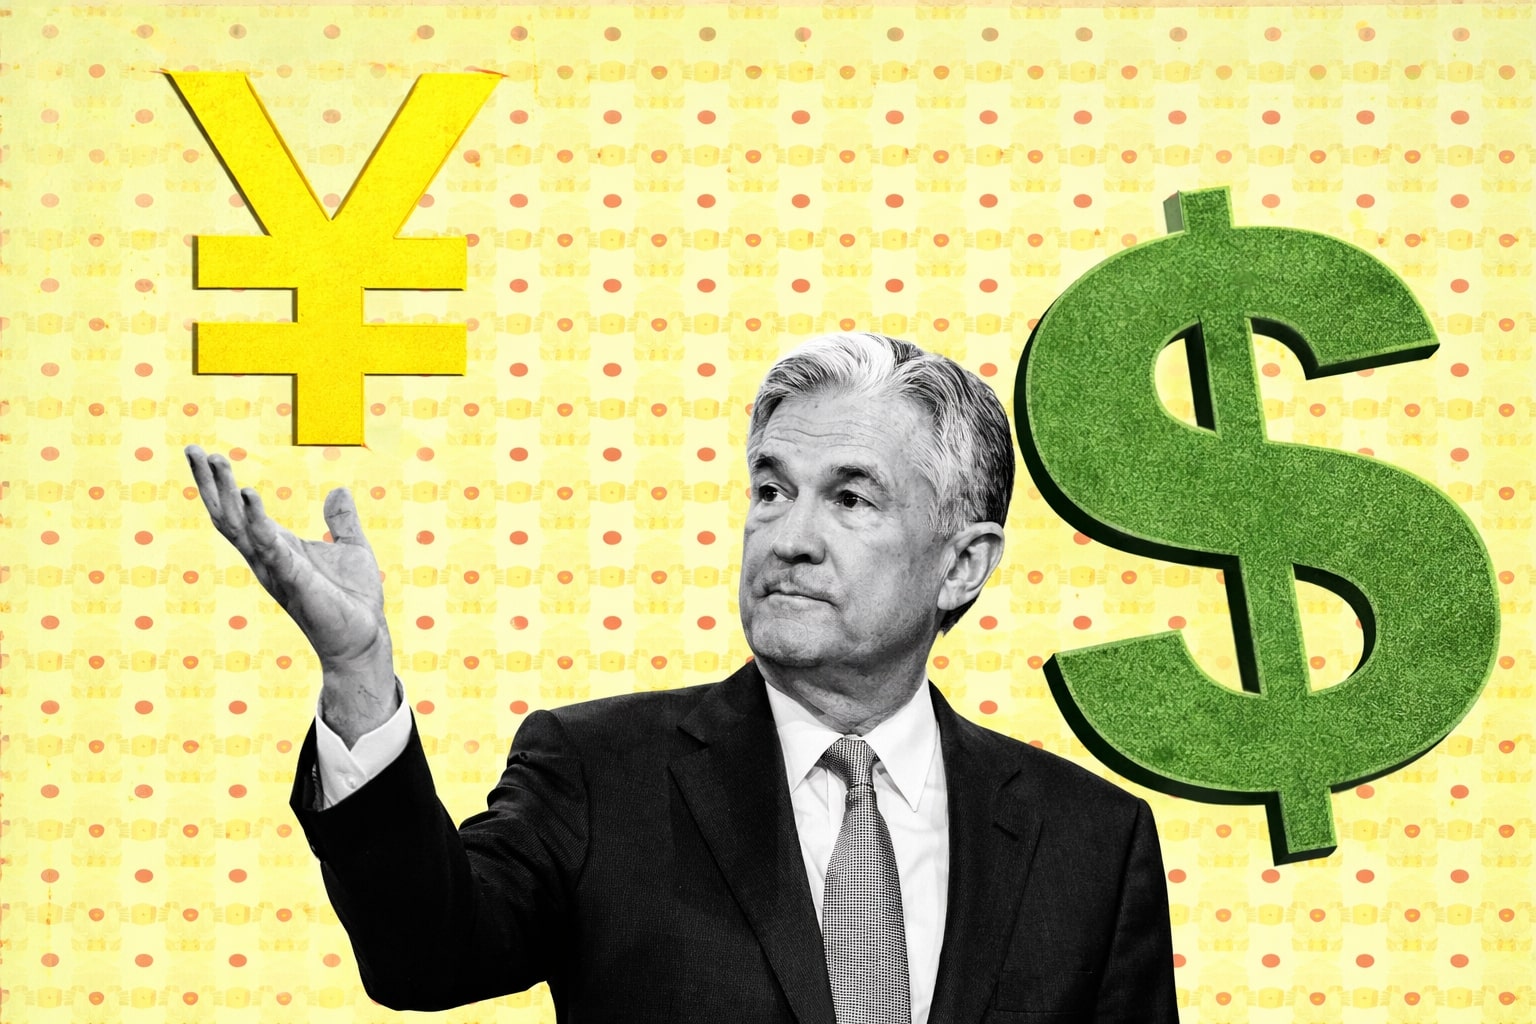
Gold prices are making an assertive return following a period of suppression. The ascendency of the US dollar and economic growth concerns in China are increasingly playing a role in these shifts. With real yields beginning to fall, expectations are growing that Fed Chair Jerome Powell may opt for a more accommodative stance on interest rates, possibly signaling this shift at the upcoming Jackson Hole Economic Symposium.
China's real estate giant Evergrande's bankruptcy filing in a U.S. court, following its defaults on substantial debts in 2021, has fueled market unease. The tremors felt across the financial markets might enhance gold's appeal as a safe-haven asset, as investors seek refuge from market volatility.
B. Technical Indicators and Resistance Levels
The XAU/USD price action is approaching a critical juncture, with the falling wedge chart pattern and Relative Strength Index (RSI) indicating potential downside or upside. A confirmation close above or below specific thresholds could trigger significant market movements.
Resistance levels to watch include:
- 200-day moving average
- 1900.00 psychological handle
- Wedge resistance
On the support side, levels include:
- 1890.21
- 1858.33
II. Weekly Performance Analysis and Chinese Influence
A. Consolidation and Weekly Decline
The XAU/USD Gold spot demonstrated a slight recovery towards $1,890, though it closed the week with a 1% decline. This marks its fourth consecutive weekly loss. Consolidation of losses is evident, but the boost in gold prices due to risk aversion, particularly concerning China's economy, is noteworthy.
B. Impact of Chinese Real Estate and Market Mood
A sour market mood was driven by Evergrande's filing for bankruptcy protection. Concerns over China's economic health and the ripple effects from the real estate sector contribute to risk aversion. This development might influence investors to seek refuge in gold, potentially benefiting the yellow metal in upcoming sessions.
III. Interest Rates and Treasury Yields Impact
A. U.S. Treasury Yields Dynamics
The XAU/USD's decline can also be attributed to the sharp rise in U.S. Treasury yields, a factor often considered the opportunity cost of holding gold. Hawkish stances from the Federal Open Market Committee (FOMC) and possibilities of another rate hike have played a role in the fluctuation of gold prices. By the week's end, declining U.S. rates provided the metal with some traction.
B. Technical Levels and Indicators
The daily chart of XAU/USD suggests a neutral to bearish stance. Specific indications, such as the Relative Strength Index (RSI) and the Moving Average Convergence (MACD), may signal potential changes in buying pressure. Support levels include $1,870, $1,850, and $1,830, with resistance at $1,900, $1,906 (200-day SMA), and $1,930.
IV. A Week of Loss and Prospects
A. Influencing Factors and Market Reactions
Gold price lost more than 1% over the week, influenced by surging yields and China-related woes. The decline below $1,900 is the first such dip in five months, leading to increased pressure on gold. The upcoming Jackson Hole Symposium and headlines from China could guide the pair's action in the coming week.
B. Technical Outlook and Potential Trends
A daily close below the 200-day Simple Moving Average (SMA) highlights sellers' dominance. Various support and resistance levels are crucial to monitoring for potential extended downtrends or recovery attempts.
V. Market Relationships: Yield, Stock Market, and Gold
A. Interplay between Yields and Gold
As yields are surging and stocks selling off, the gold market is undergoing critical shifts. The still tight Federal Reserve policy and potential interest rate hikes in 2023 are shaping market behaviors across bonds, tech stocks, and commodities such as gold and silver.
The intricate interplay between these diverse market elements offers a complex yet fascinating insight into global financial dynamics. Market participants would do well to keep a close eye on these interdependencies, as well as on key events and announcements in the coming days, to gauge the future trajectory of gold and other related assets. The financial landscape continues to evolve, and the gold market, being a central part of this mosaic, remains a focal point for investors and analysts alike.
VI. Global Economic Forces and their Impact on Gold
A. The Real Estate Sector in China
China's real estate giants, including Country Garden Holdings, have cast a shadow over the global market. Their actions and announcements have propelled the US Dollar, placing downward pressure on gold. The bankruptcy protection filing of Evergrande, one of China's largest real estate firms, has intensified these effects.
B. The Technical Outlook for Gold
Gold's technicals are signaling seller dominance with specific breakpoints identified. Static levels at $1,880 and various Fibonacci retracement levels provide a roadmap for potential movement.
VII. Importance of Jackson Hole Symposium and BRICS Summit
A. Potential Volatility and Impact on Gold Prices
The Jackson Hole Symposium may hold significant sway over gold's behavior, as it has the potential to reshape the Federal Reserve's stance. Additionally, the BRICS summit could influence both gold and broader market sentiment.
VIII. The Dynamics of Gold in the Global Economy
A. Weekly Performance and Losses
Gold's price ended the week at $1,890, but not without a 1% weekly decline. This marks a continuation of a downward trend, as its fourth consecutive weekly loss. The coming week might present opportunities for stabilization above $1,900, which could discourage bears from further selling.
B. Interactions between Gold, Yield, and Stock Market
As the interplay between yields, stocks, and gold continues to unfold, market behaviors are adapting to policy decisions and geopolitical events. The tight Federal Reserve policy and looming interest rate hikes in 2023 are leading the charge in shaping these behaviors, including those within bonds, tech stocks, and commodities such as gold and silver.
IX. Concluding Remarks on the Patterns and Indicators
A. Gold's Falling Wedge Chart Pattern
The XAU/USD's price action is closing in on a falling wedge pattern that has been forming over recent weeks. A definitive close above or below certain psychological levels may ignite either an upside rally or a significant selloff.
B. Resistance and Support Levels
Key resistance and support levels for XAU/USD remain instrumental in gauging the potential future movements:
- Resistance Levels
- 200-day moving average (blue)
- 1900.00
- Wedge resistance
- Support Levels
- 1890.21
- 1858.33
- Additional support levels at $1,870, $1,850, $1,830
C. Final Take on Technical Indicators
The daily chart maintains a neutral to bearish stance for XAU/USD. Technical indicators such as RSI and MACD display specific patterns, foretelling potential shifts in buying pressure.
This synthesized perspective on gold offers a comprehensive understanding of the forces shaping its price and the interrelated dynamics within the global economy. From the resurgence in gold prices to the influential gatherings at the Jackson Hole Symposium and the BRICS summit, the analysis delineates the intricate factors contributing to the present and potential future trajectories of gold
That's TradingNEWS
Read More
-
GPIX ETF 8% Monthly Yield and S&P 500 Upside at $53
13.01.2026 · TradingNEWS ArchiveStocks
-
XRP ETFs XRPI, XRPR and Bitwise XRP Pull In $1.5B as XRP-USD Stalls Around $2.13
13.01.2026 · TradingNEWS ArchiveCrypto
-
Natural Gas Price Forecast: NG=F Climbs Off $3.00 Floor as Cold Snap and LNG Flows Lift UNG
13.01.2026 · TradingNEWS ArchiveCommodities
-
USD/JPY Price Forecast - USDJPY=X Charges Toward ¥159 as Japan Election Fears Hit the Yen
13.01.2026 · TradingNEWS ArchiveForex