Why Is Gold Surging to $3,456/Oz This April?
With the dollar weakening and tariffs escalating, will gold’s next leg up push XAU/USD beyond $4,000? | That's TradingNEWS
Record-Breaking Surge in Gold Prices (XAU/USD)
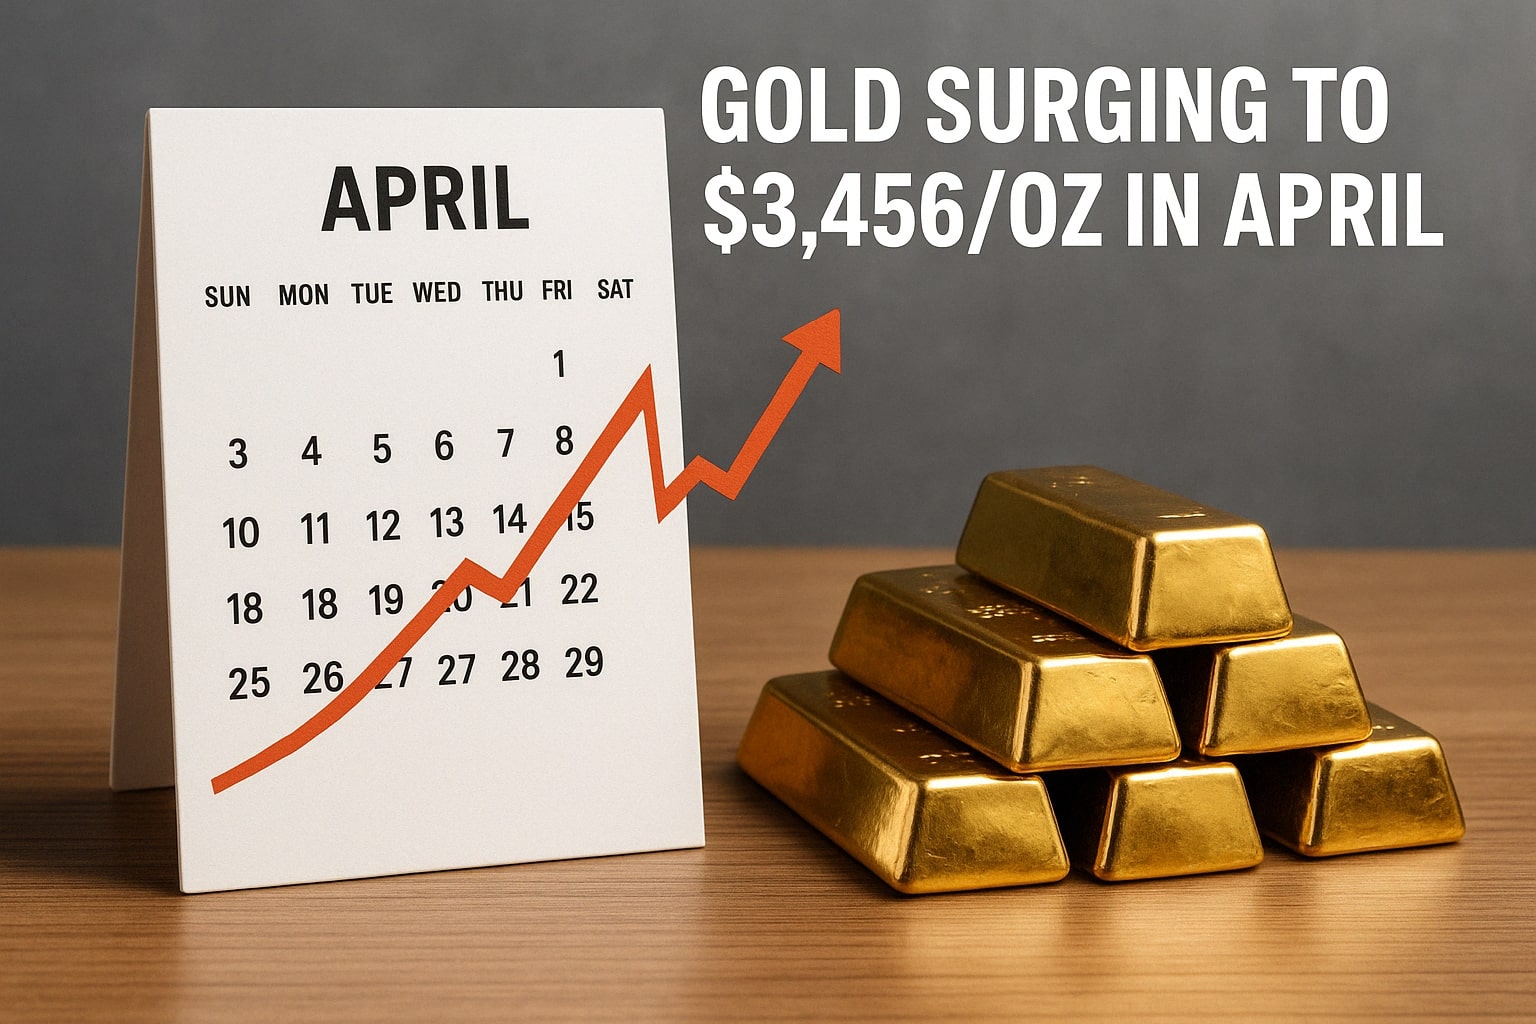
Gold leapt past the $3,450 per ounce threshold in Asian trading, marking an all‑time high that eclipses the April 2 peak of $3,139.90. By Tuesday morning, XAU/USD stood at $3,456.20, driven by a rush into haven assets amid growing fears of a U.S. recession and market turbulence. The relentless climb represents a 29.4 percent gain since January, dwarfing the 19 percent year‑over‑year increase recorded at the start of the month. Daily candles on the spot chart reveal consecutive record closes punctuated by short‑lived pullbacks, underscoring gold’s position as the pre‑eminent store of value in the current environment.
Federal Reserve Under Fire and Weakening U.S. Dollar
President Trump’s public rebukes of Fed Chair Powell, coupled with reports the administration explored removing the central bank chief, have sown doubts about the Fed’s independence. The U.S. dollar index slid to a three‑year low this week, its decline mirrored almost dollar‑for‑dollar by gold’s ascent. Historically, gold and the greenback exhibit an inverse relationship; when the dollar falters on trade policy uncertainty or geopolitical discord, investors pivot toward XAU/USD. Recent commitments by the Fed to potentially implement two 25‑basis‑point rate cuts by year‑end have further eroded real yields, bolstering gold’s carry‑free appeal against U.S. Treasuries.
Trade War Escalation and Geopolitical Flashpoints
The tariff tit‑for‑tat between Washington and Beijing has intensified safe‑haven flows. U.S. tariffs on Chinese imports soared to 145 percent while Beijing retaliated with levies up to 125 percent. The March ceasefire breakdown between Russia and Ukraine added a fresh layer of instability, stoking concerns over energy security and regional fallout. These developments coincide with a 40‑year high in the Economic Policy Uncertainty Index, reflected in gold’s premium breakout above $3,400. Investors fear that further hikes or the threat of new semiconductor and electronics tariffs will damp economic growth while igniting inflation—conditions that historically favor gold.
Central Banks and Record ETF Inflows
Central bank buying and ETF demand have underpinned gold’s record rally. Following Russia’s reserve asset freeze in 2022, global monetary authorities accelerated purchases, with China’s People’s Bank expanding reserves for the fifth straight month. Goldman Sachs now models central bank demand at 70 tonnes per month, up from 50 tonnes, sustaining a structural bid beneath XAU/USD. Exchange‑traded funds have absorbed a comparable deluge: year‑to‑date gold‑ETF holdings rose by 107.5 tonnes, led by North America’s SPDR Gold Trust adding 32 tonnes. Germany, the U.K. and China exhibited robust ETF inflows of 15.2, 14.1 and 13 tonnes respectively, as institutional and retail players alike leverage ETFs to rapidly gain physical metal exposure.
Technical Landscape: RSI Overbought and Fibonacci Targets
The daily RSI for XAU/USD has lingered above 70 for two weeks, signaling an overbought condition even as prices press ever higher. A textbook pin bar rejection of lower prices at $3,321 on April 17 foreshadowed the extension to $3,456 this week. Key support zones cluster around $3,150 and the psychological $3,000 mark, while resistance pivots at each new peak. Applying Fibonacci extensions from the December low near $2,600 through the April high and intermediate pullback projects a target near $3,900, suggesting that the nearest climax may lie ahead. Yet, strong momentum cautions that bears risk standing in front of a charging locomotive until technical exhaustion sets in.
Analyst Forecasts and 2025 Projections
Gold strategists have lifted year‑end forecasts to reflect the relentless advance in XAU/USD. Goldman now pegs the December 2025 price at $3,300, up from $3,100, while Trading Economics anticipates $3,371 by quarter‑end and $3,510 in twelve months. Some contrarian voices still eye lower yields of $3,060 if Fed easing stalls, but consensus tilts bullish amid central bank demand and persistent policy uncertainty. Long‑term optimists invoke the structural forces of de‑dollarization and mounting national debts to argue for a multi‑year trajectory toward $4,000 and beyond.
Gold Versus Silver: Correlation and Relative Strength
Silver followed gold sharply higher this spring, trading near $42.15 per ounce, which equates to a gold‑to‑silver ratio of roughly 82:1. Silver’s year‑to‑date gain of 37 percent outpaces gold’s 29 percent but exhibits greater volatility. Industrial demand and limited new supply amplify silver’s swings, while gold remains the bedrock safe‑haven. Investors balancing portfolio risk may dial exposure across both metals, capitalizing on silver’s leverage to industrial trends and gold’s unshakeable store‑of‑value status.
Paths to Gold Exposure: Physical, ETFs, Futures and Certificates
Private investors can choose from multiple avenues to accumulate gold. Physical bullion—bars or coins of 99.9 percent purity—commands spot plus a dealer premium covering minting and handling. Gold ETFs provide pure price tracking with minimal storage concerns, while futures on COMEX offer leverage and intraday liquidity. For those preferring nongovernmental custody, gold certificates grant legal title to allocated metal without physical delivery. Each structure carries trade‑off considerations in premium, liquidity, storage and counterparty risk that must align with individual objectives.
Supply‑Demand Dynamics and Shanghai’s Growing Role
On the supply side, gold emerges from mining output, recycling and occasional central bank sales. Demand springs from jewelry, technology, investment and official reserves. China’s Shanghai Futures Exchange has become pivotal, reflecting the nation’s dual role as the world’s largest gold consumer and a leading producer. The SFE’s yuan‑denominated futures contracts traded above 800 yuan per gram this month, mirroring international upticks. As global forces tilt toward de‑dollarization, China’s vaults and trading platforms are poised to wield outsized influence on future price formation.
Historical Context: From $35 to $3,400 – Gold’s Epic Transformation
Gold’s odyssey from the fixed $35 ounce under Bretton Woods to today’s $3,456 price epitomizes monetary evolution. The 1970s cyclone surge from $35 to $800 gave way to the 2008 crisis rally from $700 to $1,900 by 2011. In each upheaval—oil shocks, financial contagion or pandemic—gold stood resolute. The current bull run, ignited in 2019 and turbocharged by trade wars, pandemic‑era stimulus and burgeoning national debts, showcases gold’s perennial role as the ultimate insurance policy against fiat erosion.
After integrating all fundamental drivers, technical signals and historical parallels, my stance on XAU/USD leans bullish. The confluence of central bank appetite, ETF inflows, geopolitical tension and Fed rate‑cut expectations supports further upside. From a risk‑reward perspective, dips toward $3,200 and even $3,000 offer compelling entry points before a likely advance toward the $3,900 area highlighted by Fibonacci projections. Gold remains the crown jewel of portfolio diversification, and I recommend adding to long positions on weakness in anticipation of a continued bull‑market climax.
That's TradingNEWS
Read More
-
Oracle Stock Price Forecast - ORCL Near $200: Is a $523B AI Backlog Still Mispriced?
11.01.2026 · TradingNEWS ArchiveStocks
-
XRP Price Forecast - XRP-USD Holds $2.10 While ETF Flows and UK FCA Nod Target $2.40–$2.50
11.01.2026 · TradingNEWS ArchiveCrypto
-
Natural Gas Price Forecast - NG=F Near $3.33: NG=F Sinks as Supply Surges and China Cools LNG Demand
11.01.2026 · TradingNEWS ArchiveCommodities
-
Stock Market Today: S&P 500 at 6,966 as Bank Earnings and TSMC Test the Rally
11.01.2026 · TradingNEWS ArchiveMarkets
-
GBP/USD Price Forecast - Pound Slides Toward 1.34 Floor as Strong USD Data and BoE Cut Risk Put 1.30 on the Radar
11.01.2026 · TradingNEWS ArchiveForex


