American Eagle Stock (AEO Stock) Breaks Out on Meme Hype Even as Q1 Sales Slip
Viral endorsement propels NYSE:AOE above its 200-day SMA, but 5% revenue decline and 100-basis-point margin compression underscore broader apparel downturn and ongoing inventory corrections | That's TradingNEWS
Market Reaction To Social Media Endorsement And Meme Stock Dynamics
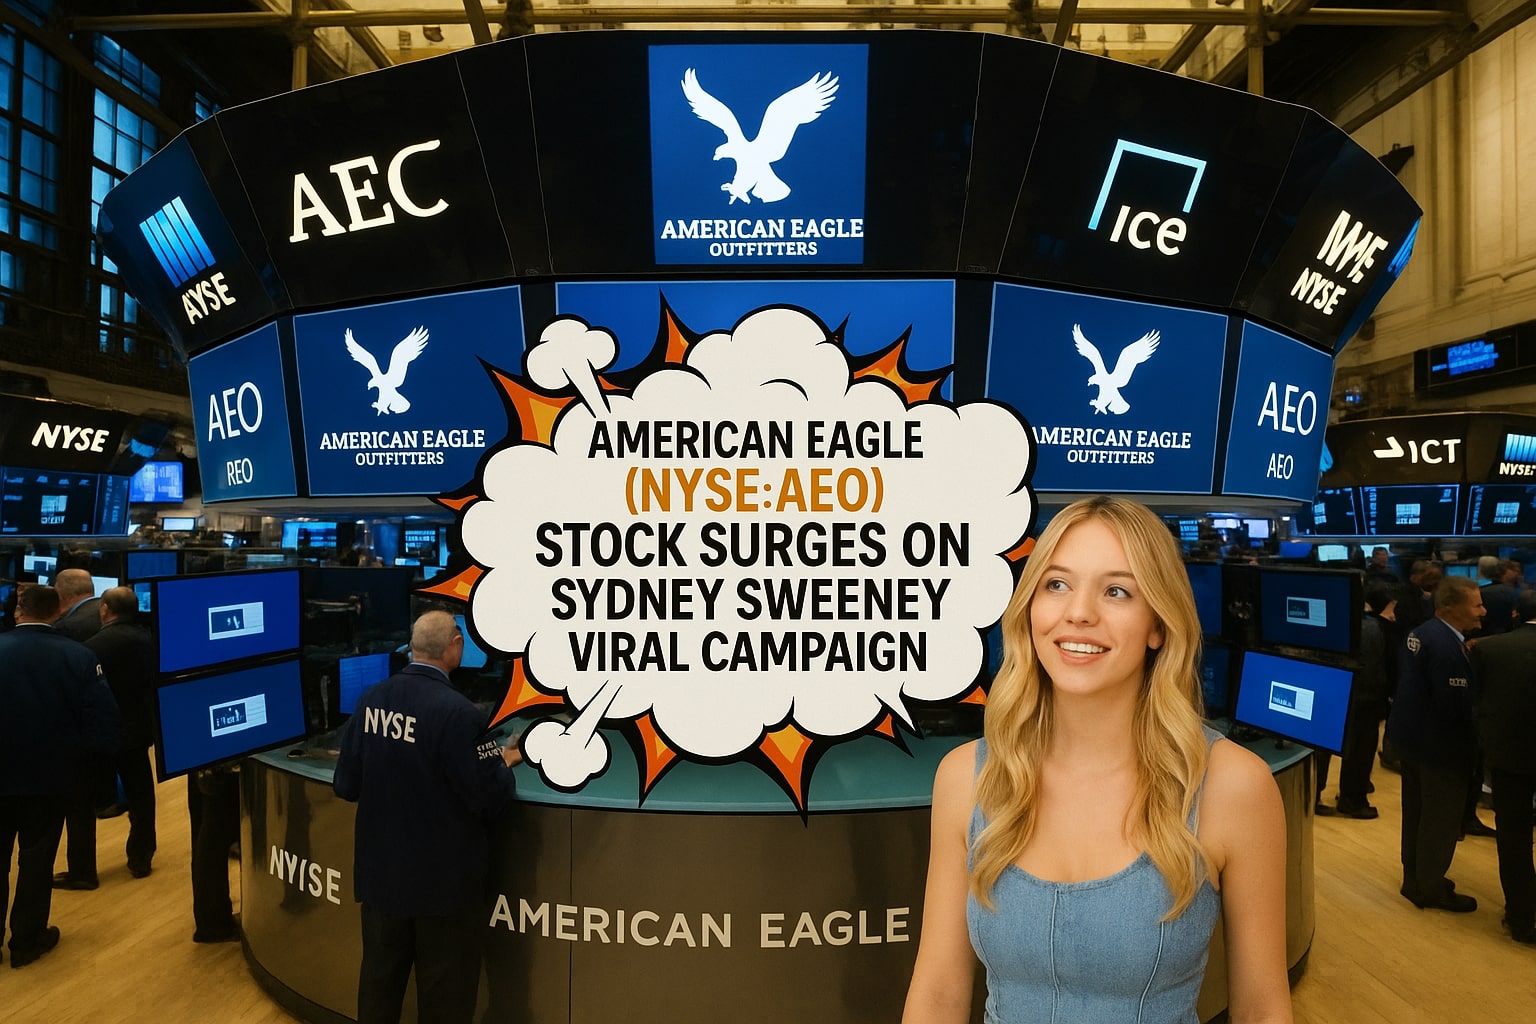
Shares of NYSE:AOE exploded by more than 23% on August 4th after former President Trump praised the retailer’s Sydney Sweeney–led campaign as the “HOTTEST ad out there,” propelling the stock into meme territory and drawing speculative volume far beyond the usual retail fashion cohort. After peaking at $13.12, the equity pulled back to $12.28 yet continued to trade 20% above its July lows near $10.00. The social-media frenzy amplified web traffic by 19% in the ad’s first week, though sales growth moderated to 11% year-over-year in the subsequent week, underscoring the disconnect between viral buzz and underlying demand. Despite fleeting hype, the episode illustrated NYSE:AOE’s vulnerability to sentiment-driven swings, with 23 moves greater than ±5% over the past year highlighting its elevated volatility profile.
Underlying Top-Line Pressures And Sector Context
American Eagle’s Q1 2025 financials reflected a 5% revenue contraction to $1.05 billion and a 3% comparable-store-sales decline, mirroring a broader apparel downturn where peers like Puma and Kering recorded double-digit dips, while Adidas and Levi’s maintained growth. The apparel segment’s cyclicality and macro drags—sticky inflation weighing on discretionary spending, rising inventory levels up 8%, and supply-chain rebounds from pandemic distortions—exert uniform headwinds. Management’s decision to withdraw full-year guidance but forecast continued comparable-sales declines in Q2 suggests further softness may persist into year-end, with sector-wide comp-turnover dynamics dictating amplitude rather than idiosyncratic brand weakness.
Margin Compression And Inventory Management
Gross margins shrank to approximately 29% in Q1, driven by an $80 million inventory write-down and elevated promotional intensity necessary to clear excess goods. Ending inventories have eased by 5% sequentially, yet supply-chain optimization expenses and tariff-hedging actions are expected to pressure margins through summer before tailwinds from leaner stock levels manifest. Despite defensive capex cuts from $300 million to $275 million, promotional cadence remains aggressive, with markdown rates rising to 18% of sales. Operational expense control—targeting $25 million in SG&A savings next fiscal year—will be critical to offset margin erosion as merchandise mix shifts back toward full-price frameworks.
Valuation De-Rating And Dividend Support
With forward EV/EBITDA at just 4.8×—near the lowest decile of its five-year trading range—NYSE:AOE is priced for protracted weakness. At $12.89 per share, the company trades 43% below its $22.70 52-week high and offers a 4.5% dividend yield at a 47% payout ratio that remains sustainable unless earnings plummet more than 30% from current consensus of $1.10 EPS in fiscal 2026. Insider transactions have been modestly net-positive, with two directors adding shares this quarter, signaling confidence in the turnaround roadmap. The steep de-rating, set against a cyclical trough and structural brand resilience, presents a valuation floor near psychological support at $10.00.
Technical Chart Patterns And Momentum Shifts
Technically, NYSE:AOE carved a near-term base around $11.50 after falling through its 50- and 100-day SMAs in June. The Trump-fuelled spike breached the 200-day SMA at $12.00, yet it failed to sustain above that level, indicating profit-taking at key resistances. Relative Strength Index (RSI) soared to overbought territory at 78 before retracting to 62, suggesting cooling momentum. On-balance volume remains neutral, reflecting balanced buying and selling post-endorsement. A sustained close above the 200-day SMA would validate a bullish reversal, targeting $13.50 and $14.75 on extensions, while a drop below $11.50 would open a retest of the 2025 low near $10.00.
Forecast Scenarios And Recommendation
If the apparel cycle stabilizes in Q3, comps may flatten as easier comparisons and leaner inventories reduce promotional drag, potentially lifting revenue growth back toward breakeven by holiday season. Gross margin recovery of 100 basis points could follow normalized stock levels, driving EPS toward $1.25 in fiscal 2026. Conversely, protracted macro weakness and execution missteps in product assortment risk further earnings cuts to $1.00 and share price slides toward $9.00. Balancing headline-driven volatility against deep value and durable brand equity, the risk‐reward tilts toward a BUY stance for patient investors, with a clear entry zone of $11.50–$12.00 and a target range of $14.00–$15.00 over the next 12 months, while stop-loss protection near $10.50 guards against deeper structural deterioration.
That's TradingNEWS
Read More
-
GPIX ETF Climbs to $52.54 as 8% Yield Turns S&P 500 Volatility Into Income
02.01.2026 · TradingNEWS ArchiveStocks
-
XRP ETF Rally: XRPI $11.54, XRPR $16.35 And XRP-USD At $1.99 Aim For A $5–$8 Cycle
02.01.2026 · TradingNEWS ArchiveCrypto
-
Natural Gas Price Forecast: NG=F Tests $3.50–$3.60 Floor Before LNG Wave
02.01.2026 · TradingNEWS ArchiveCommodities
-
USD/JPY Price Forecast - USDJPY=X Holds Near 157 as BoJ Caution and Fed Cut Bets Drive the Move
02.01.2026 · TradingNEWS ArchiveForex


