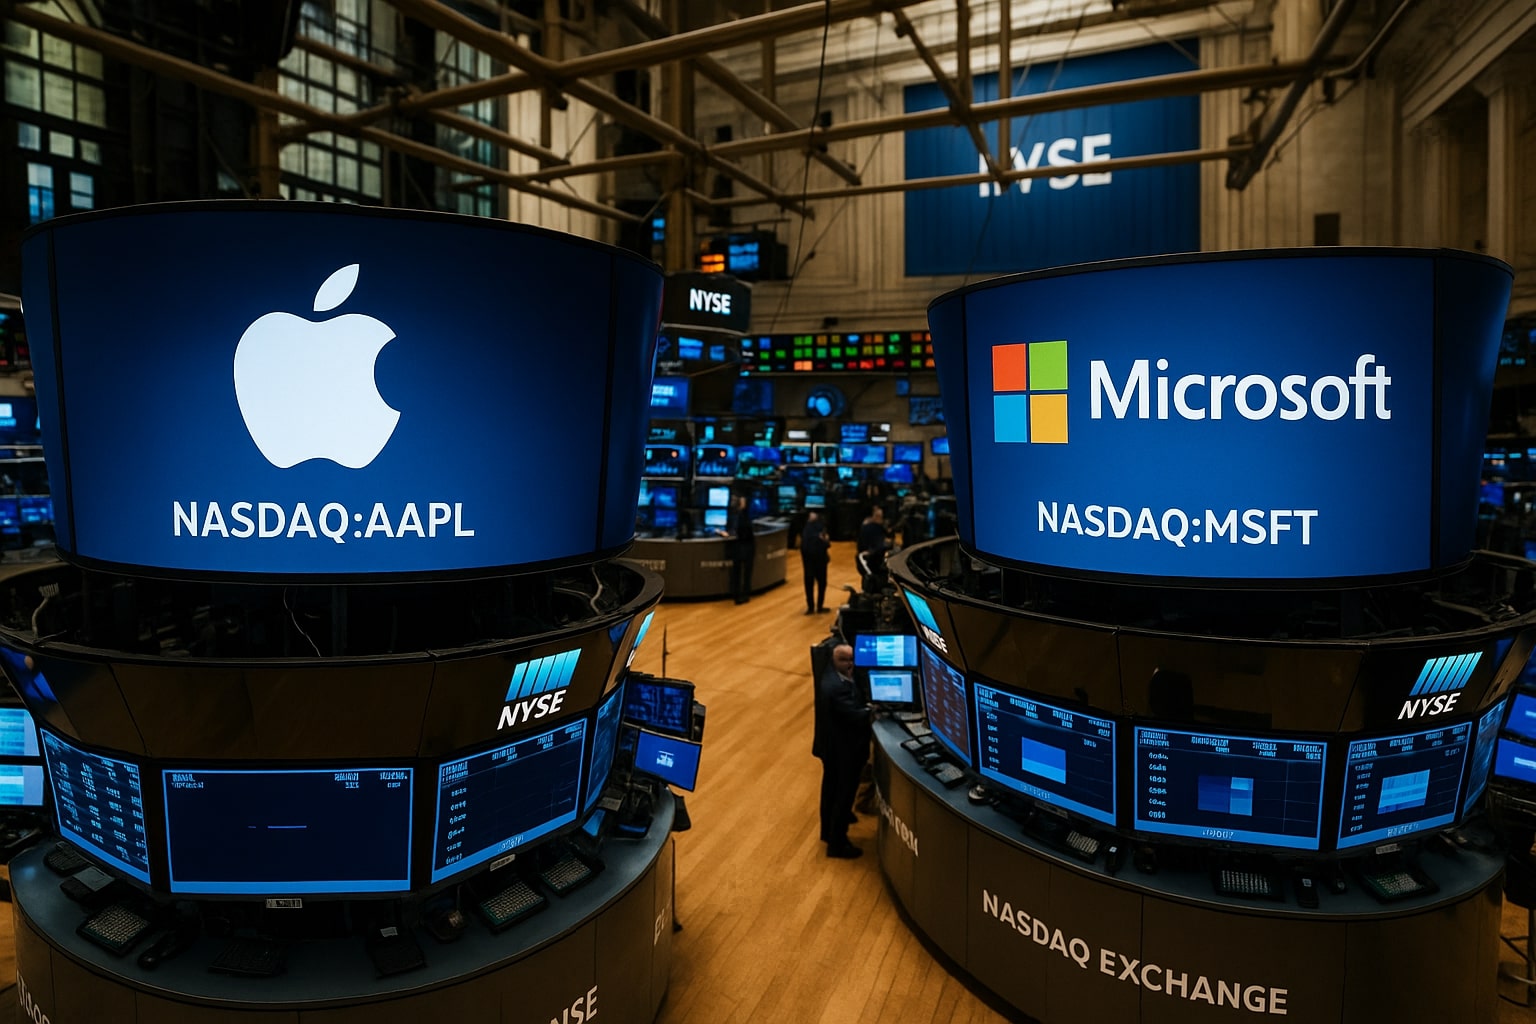
Apple Stock vs Microsoft Stock – AAPL at $232 Trails in AI as MSFT at $506 Extends Cloud Lead – Who Wins?
Apple earns $99.3B profit with $94.9B free cash flow, but Microsoft posts $101.8B net income and 36% margins, signaling stronger upside toward $613–$700 targets | That's TradingNEWS
Apple (NASDAQ:AAPL) vs Microsoft (NASDAQ:MSFT) – The Two Giants at the Center of Market Power
Apple (NASDAQ:AAPL) trades at $232.14, down slightly by 0.18% at the last close, with a market capitalization of $3.445 trillion. Microsoft (NASDAQ:MSFT) finished at $506.69, also lower by 0.58%, but with a larger valuation of $3.766 trillion, officially making it the most valuable company in the world. These two names, once running neck-and-neck for the top spot, are no longer priced the same way by investors, and the reasons come down to execution, future growth, and how each company is positioned for the artificial intelligence wave that is dominating the market narrative.
Apple’s Revenue Strength vs Microsoft’s Margin Superiority
Apple’s revenue base remains the largest in big tech at $408.6 billion over the trailing twelve months. iPhone sales remain the single most important driver, generating $44.6 billion last quarter alone, with $15.4 billion coming from China, a market where Apple has managed to stabilize after repeated declines. Net income for Apple stands at $99.3 billion, giving it a 24.3% profit margin.
Microsoft, on the other hand, operates at a smaller topline of $281.7 billion, but converts more into earnings, with net income of $101.8 billion, a margin of 36.1%. Its gross profit reached $193.9 billion, translating to a 44.9% operating margin. Apple’s margin is close to 30%, but Microsoft’s mix of enterprise software, cloud, and productivity subscriptions gives it a much stronger profitability profile. This margin superiority is one of the main reasons MSFT commands a higher valuation multiple.
Valuation Metrics and Market Perception
Apple trades on a trailing P/E ratio of 35.2x and a forward P/E of 29.1x. Its price-to-sales ratio sits at 8.6x, while price-to-book value is a staggering 52.3x, reflecting the weight of buybacks on its balance sheet. Analysts have set a one-year price target range of $175 to $300, with an average of $235 — meaning Apple is essentially trading right at fair value today.
Microsoft trades richer, with a P/E ratio of 37.2x and a forward multiple of 32.8x. Its price-to-sales ratio is 13.4x, well above Apple’s, but its price-to-book is only 11.0x, a reflection of stronger retained equity compared to Apple’s heavily reduced book value. Analyst targets for MSFT range from $483 to $700, with the average at $613, giving the stock more than 20% potential upside from today’s price. The Street’s posture is clear: Apple is fairly priced, Microsoft is still underpriced relative to growth.
Growth Drivers: iPhone 17 Launch vs Azure and Copilot
For Apple, the iPhone remains the foundation. The upcoming iPhone 17 cycle could lift December quarter revenue expectations, which currently stand at $129.6 billion, up from $124.3 billion a year earlier. Services are now the company’s second-largest segment, generating $27.4 billion last quarter, up 13% year-over-year, setting a record. The broader business mix, however, has not yet seen a breakthrough growth driver beyond iPhone and Services. Apple’s late start in AI and delays in its “Apple Intelligence” rollout are seen as serious weaknesses compared to peers. Analysts and investors increasingly worry that Apple is missing its next “iPhone moment.”
Microsoft’s growth story looks much more dynamic. Azure cloud revenues grew 39% year-over-year in the latest quarter, a rate that dwarfs almost every large-cap peer. Office subscriptions are accelerating with Copilot AI integration, which analysts see as a structural revenue driver for years ahead. Microsoft’s fiscal 2026 revenue is projected at $322.6 billion, growing to $370 billion in 2027, translating to annual growth rates in the mid-teens. In contrast, Apple is projected to grow from $415 billion in 2025 to $435 billion in 2026, only in the mid-single-digit range.
Balance Sheet, Cash Flow, and Capital Allocation
Apple has $55.4 billion in cash and $101.7 billion in debt, leaving it in a net debt position. Its operating cash flow of $108.6 billion and free cash flow of $94.9 billion remain unmatched, allowing it to sustain aggressive buybacks. Apple’s book value per share is just $4.43 due to these repurchases, but its shareholder return strategy keeps demand for the stock intact.
Microsoft has $94.6 billion in cash against $112.2 billion in debt, but its balance sheet is also extremely robust. Its operating cash flow of $136.2 billion leaves $61.1 billion in free cash flow after capital expenditures. The difference is that Microsoft is spending more aggressively, with CapEx of $17.1 billion last quarter, nearly double levels of two years ago, much of it allocated toward AI data centers and infrastructure. This has compressed its CFO-to-CapEx coverage ratio to 2.5x, down from a historical 4x, reflecting its all-in AI investment cycle.
Dividend Policies and Institutional Confidence
Apple pays a forward dividend of $1.04 per share, yielding 0.45%, with a conservative payout ratio of 15.3%. Microsoft offers $3.32 per share, yielding 0.66%, with a payout ratio of 23.8%. Both prioritize growth over yield, but Microsoft’s dividend growth rate of 11% YoY is outpacing Apple’s slower increases.
Institutional investors also show stronger conviction in Microsoft. Insider ownership in Apple is 1.97%, with institutions controlling 63.7%, while insider activity can be tracked here. Microsoft insiders hold only 0.07%, but institutions dominate with 74.5% ownership, giving the stock deep support in corrections. Insider activity for MSFT is available here. Short interest is minimal in both, at 0.86% of float for Apple and 0.76% for Microsoft, showing no large bearish bets.
Market Behavior and Correlation
Apple no longer sets the market tone as it once did. Its correlation with the S&P 500 is only 0.27, while its correlation with the Russell 2000 small-cap index is 0.66, meaning Apple’s sideways movement mirrors small-cap churn rather than large-cap leadership. The stock has been range-bound between $215 and $260, with resistance at the 52-week high of $260.10. Microsoft, by contrast, is behaving like the new market anchor. Its 52-week range is $344.79 to $555.45, and it is trading close to the upper end, with support near $500 and resistance at $555. Analyst targets at $613 to $700 suggest momentum is still intact.
Final Take
At $232, Apple is a Hold. Its upside is limited to $300 at the top of the target range, with a fair value closer to $185–$200 on discounted cash flow models. The iPhone 17 cycle may provide a short-term boost, but services alone cannot offset lagging AI execution and stagnant hardware growth.
At $506, Microsoft is a Buy. With Azure’s 39% growth, Copilot monetization, and aggressive AI-driven CapEx, it is positioned to break through $613–$650 in the next 12 months, with some bullish calls as high as $700. Its operating margins, institutional support, and stronger growth profile justify the premium.
That's TradingNEWS
Read More
-
AbbVie Stock Price Forecast - ABBV at $229 Turns the Humira Cliff Into a 2026 Growth Engine
02.01.2026 · TradingNEWS ArchiveStocks
-
XRP Price Forecast - XRP-USD Nears $2 as $1.80 Support and Shrinking Supply Point to $2.60 Target
02.01.2026 · TradingNEWS ArchiveCrypto
-
Oil Price Forecast - Oil Slide Into 2026: WTI Stuck at $57, Brent at $60
02.01.2026 · TradingNEWS ArchiveCommodities
-
Stock Market Today: Nasdaq Hits 23,467 as Nvidia (NVDA), Micron (MU) and Baidu (BIDU) Drive AI Surge
02.01.2026 · TradingNEWS ArchiveMarkets
-
GBP/USD Price Forecast: Pound Holds 1.3450 as Fed–BoE Split Keeps Bulls Aiming at 1.37
02.01.2026 · TradingNEWS ArchiveForex