Gold Price Forecast - Gold Near $4,470: XAU/USD Compresses Below $4,5K Ahead of US NFP Shock

Gold Price Forecast - Gold Near $4,470: XAU/USD Compresses Below $4,5K Ahead of US NFP Shock

Gold defends the $4,400 floor as a strong dollar, US jobs data, tariff ruling and central-bank demand after a 64% 2025 surge set up the next break toward or away from the $4,500–$5,000 zone | That's TradingNEWS

TradingNEWS Archive 1/9/2026 5:06:33 PM
Commodities GOLD XAU/USD XAU USD

Gold Price 2026: XAU/USD At A $4,400–$4,500 Turning Point

XAU/USD And Silver Hold Near Record Zones Despite Dollar Strength

Gold (XAU/USD) is trading in the upper portion of a tight band, hovering around $4,450–$4,475 per ounce after defending the $4,400 zone and repeatedly testing resistance just below $4,500. Silver trades near $76–$77 per ounce, very close to all-time highs, and continues to outperform most commodities on a weekly basis.
Futures in Asia and Europe opened slightly higher, and both metals still show weekly gains, even as a firm US dollar and higher yields into key macro events cap the upside. The message from price action is clear: this is consolidation at altitude, not a breakdown, with $4,400–$4,500 the active battlefield for XAU/USD.

Dollar Strength, Labor Data And Why The $4,400–$4,500 Corridor Matters For XAU/USD

The current ceiling on XAU/USD is driven by macro conditions rather than weak demand for gold. The US dollar has extended a two-week advance, reaching roughly a one-month high as investors position ahead of US jobs data and Federal Reserve decisions. Initial jobless claims remain close to 208,000, signaling a still-tight labor market that limits how aggressively the Fed can guide toward rate cuts.
A stronger dollar reduces the immediate appeal of gold by raising the local-currency cost for non-US buyers and by drawing flows back into dollar assets. This explains the small pullback from above $4,495 and the repeated failures to print a clean break through $4,500, despite an intact long-term uptrend.
Markets continue to price roughly two rate cuts in 2026, but the dollar’s resilience indicates that investors do not yet believe in an aggressive easing cycle. As long as that tension persists, the $4,500 band remains a natural place for sellers to defend, while the $4,400 region acts as the key test of how committed dip buyers really are.

US NFP, Tariffs And Volatility: How Macro Catalysts Will Decide The Next Move In XAU/USD

Two near-term catalysts dominate the risk profile for XAU/USD. The first is the US Nonfarm Payrolls release, where any material deviation from expectations will reshape the path of Fed policy, yields and the dollar. A weaker-than-expected print would favor lower yields, a softer dollar and a renewed push from gold toward and potentially through $4,500. A stronger-than-expected number would support the dollar and make it harder for gold to hold the $4,400 floor.
The second is the US Supreme Court decision on Trump-era trade tariffs, a ruling that could trigger roughly $150 billion in reimbursements on previously paid levies. A market-friendly outcome that improves corporate cash flow may temporarily channel flows into risk assets at the expense of gold. A messy or geopolitically charged decision could have the opposite effect and reinforce the safe-haven bid.
Given this setup, the probability that XAU/USD simply drifts in a narrow, low-volatility band is low. The compression around $4,400–$4,500 with several major catalysts queued up is the classic staging area for a range expansion, not an extended stalemate.

Technical Structure In XAU/USD: Bullish Channel With $4,400 Support And $4,500 Resistance

The charts confirm that XAU/USD is consolidating within a bullish structure rather than topping out. On the 4-hour timeframe, gold has just bounced from the 100-period Simple Moving Average around $4,400 and reclaimed the $4,460–$4,475 region. The 20-period moving average near $4,460 is acting as dynamic support, while the 50-, 100- and 200-period averages all slope upward, with a bullish crossover in place.
Momentum signals are supportive rather than extreme. The RSI sits around 58–60, indicating positive momentum without overbought risk, and the MACD oscillates around the zero line with a shrinking negative histogram, a classic sign of fading selling pressure rather than the start of a new down-leg.
The critical zones are clearly defined. On the upside, the January 7 peak and current resistance cluster around $4,500 is the near-term breakout trigger. A daily close above that area would open space toward the $4,700–$4,800 band in subsequent weeks. On the downside, the $4,400 region is the primary line in the sand; a clean break there exposes the January 2 low near $4,310 and, if selling accelerates, a potential retest of the high-$4,200s. As long as gold holds above $4,400 and continues to close in the upper half of the range, the working assumption remains a bullish consolidation, not a reversal.

Silver Near $77 As High-Beta Confirmation Of The Precious Metals Bull Cycle

Silver’s behavior reinforces the bullish interpretation for XAU/USD. Trading in the $76–$77 area, the metal sits close to its all-time highs and has been outperforming many commodities on a weekly basis. That pattern is typical in strong precious-metal cycles, where silver behaves as a high-beta expression of the same macro forces supporting gold.
Demand for silver is anchored by both industrial usage and investment flows. Industrial demand, driven by technology and renewable energy applications, provides a fundamental floor. At the same time, investors seeking leveraged exposure to the same themes that drive XAU/USD higher—currency debasement, geopolitical risk and persistent inflation uncertainty—turn to silver as a higher-volatility companion trade.
The fact that silver is holding so close to record territory while gold digests gains just under $4,500 is inconsistent with a late-cycle topping narrative. It is much more aligned with a classic pause inside a durable bull market for precious metals.

Central Banks, The SNB And A 64% 2025 Gold Rally: Why The Strategic Bid Under XAU/USD Is Real

The Swiss National Bank (SNB) offers a concrete demonstration of how aggressively gold has rewarded large institutional holders. For 2025 the SNB booked a profit of about 26 billion Swiss francs, one of the five best results in its 119-year history. The key driver was a 36.3-billion-franc valuation gain on its gold holdings, generated by a 64% increase in the gold price over the year.
The SNB holds around 1,040 metric tons of gold, and the dramatic uplift in value helped offset significant headwinds elsewhere on its balance sheet. The central bank recorded about a 9-billion-franc loss on foreign currency positions as the franc strengthened and roughly 900 million francs of losses on Swiss franc positions largely due to interest payments on bank deposits.
This combination is instructive. In a year marked by trade conflict, tariffs from the Trump administration and global risk aversion, gold delivered record profits for a conservative central bank while traditional FX and domestic rate exposures produced losses. The signal to reserve managers and sovereign funds is straightforward: in an environment of persistent geopolitical and monetary uncertainty, underweight gold is a structural risk.
This is the same logic that sits behind institutional forecasts pushing XAU/USD scenarios up toward $5,000 in 2026. Those levels are not just click-bait; they are the natural extension of a world where major central banks treat gold as core balance-sheet insurance rather than a tactical trade.

Short-Term Flows, ETF Positioning And Index Rebalancing Behind The Current Range

The day-to-day tape in XAU/USD is being driven by a mix of ETF flows, index adjustments and profit-taking. A stronger dollar and higher yields into NFP have triggered some de-risking and rebalancing at the start of the year. Large portfolios that benefited from the 64% gold rally in 2025 are trimming positions to keep target weights in line, while more tactical traders are harvesting gains around the $4,450–$4,500 area.
Gold ETFs have shown choppy but not catastrophic flows. There is selling from investors locking in profits, but there is also demand from allocators who missed the earlier leg and now use dips toward $4,400 as an entry point. The net result is a broad range where $4,400 absorbs supply and $4,500 absorbs demand, with neither side yet delivering the decisive impulse.
The longer gold spends time absorbing flows above $4,400 without breaking down, the more energy builds behind the next directional move. Historical behavior in similar environments, combined with the current macro profile, tilts the risk toward an upside resolution once the immediate NFP and tariff overhang is out of the way.

Geopolitics, Trade Frictions And Why Dips In XAU/USD Still Attract Strategic Buyers

The geopolitical backdrop continues to justify a persistent risk premium in XAU/USD. US involvement in Venezuela, including oil supply deals that influence global energy prices and inflation expectations, adds one layer of uncertainty. Growing trade tensions between China and Japan, with anti-dumping probes and export restrictions, threaten supply chains and corporate margins. The ongoing Russia-Ukraine conflict remains a structural tail-risk for energy markets, European growth and cross-asset volatility.
In such an environment, even robust US data cannot fully neutralize demand for safe-haven assets. Upside surprises in economic releases may briefly strengthen the dollar and suppress gold, but any downside shock, escalation in trade disputes or renewed inflation scare quickly pushes investors back toward XAU/USD.
Central banks outside the US and Europe remain especially motivated to accumulate gold as protection against sanctions risk and currency debasement. That official-sector demand is one reason why pullbacks toward the $4,300–$4,400 region are being bought aggressively instead of spiraling into deeper corrections.

Key Price Zones And Scenario Map For XAU/USD In Early 2026

The current configuration for XAU/USD produces a relatively clean scenario map built around a few decisive levels. As long as gold holds above $4,400, the dominant narrative is continuation of the existing uptrend after a period of consolidation. In that case, dips into the $4,310–$4,400 zone remain attractive accumulation areas, especially if they coincide with temporary dollar spikes or stronger-than-expected data. A subsequent break and daily close above $4,500 would then be expected to unlock a move toward the $4,700–$4,800 region over the following weeks or months.
A more neutral outcome would see XAU/USD oscillating between $4,310 and $4,500, with alternating macro headlines pushing price from one end of the range to the other without delivering a lasting break. That path would frustrate trend-followers but leave the higher-timeframe bull structure intact.
A genuinely bearish short-term scenario would require a clear daily close below $4,400, driven either by a substantial repricing of Fed cuts or by a pronounced dollar surge. That would open the door to a deeper pullback toward $4,310 and possibly the high-$4,200s. Even in that case, given the magnitude of the 64% gain in 2025 and the evident central-bank bid, it would still be more consistent with a correction inside a bull market than with the start of a secular downtrend.

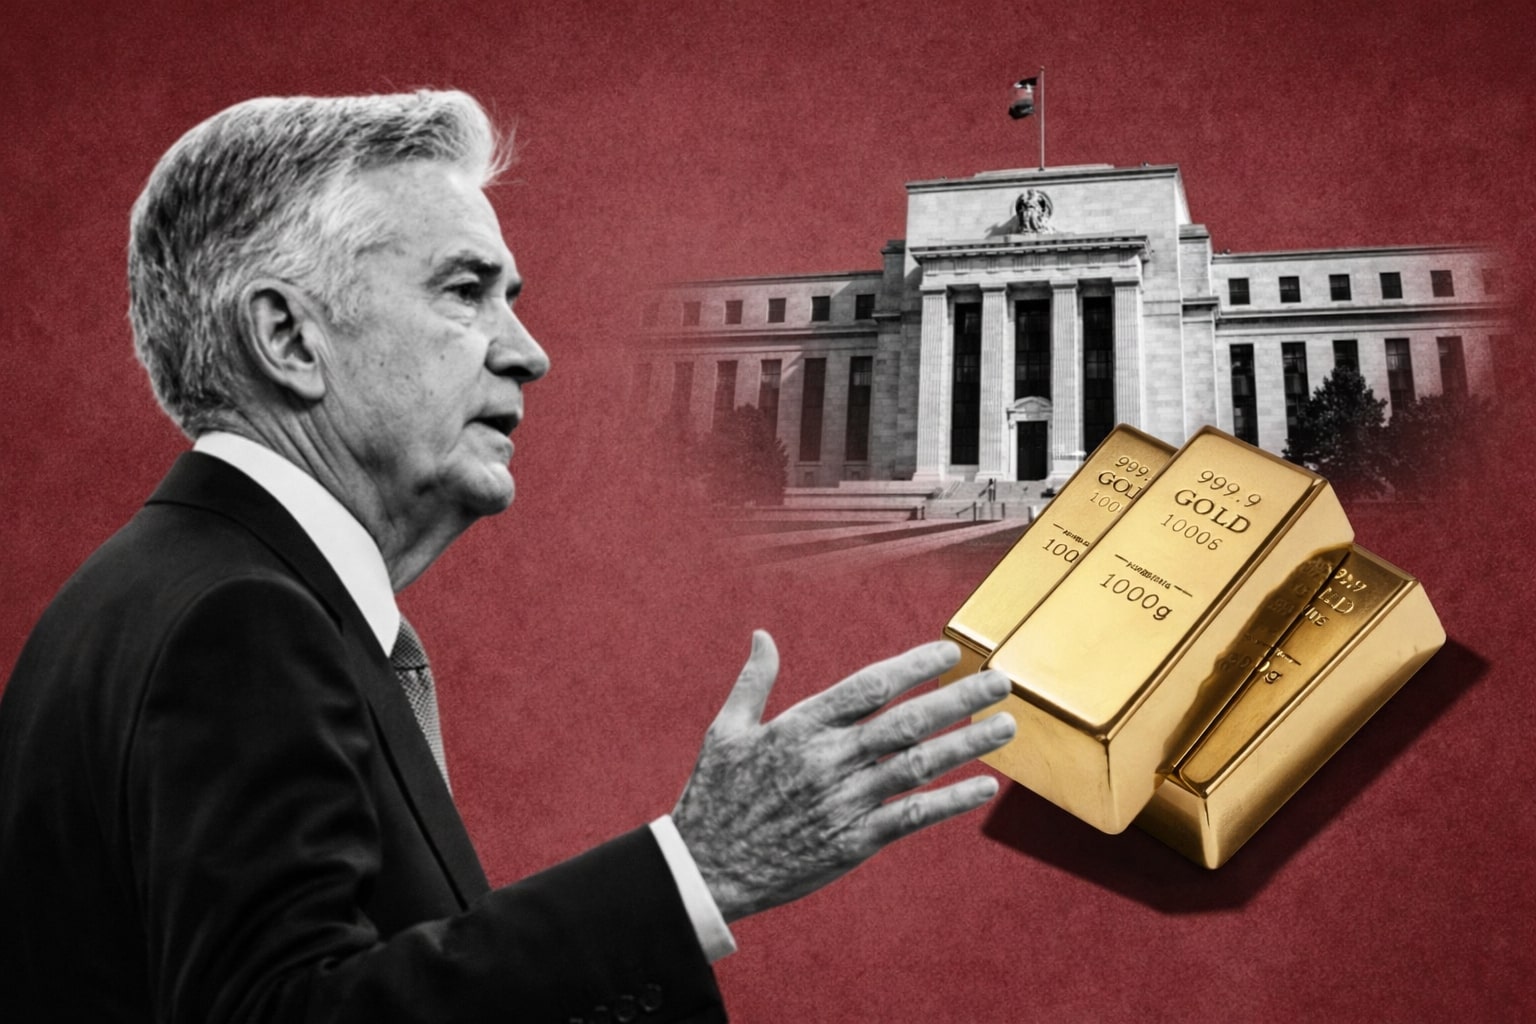
Gold (XAU/USD) View For 2026: Trend, Risk Profile And Strategic Rating

Putting the evidence together, XAU/USD remains in a strong long-term advance with price consolidating just under resistance rather than rolling over. Gold trades near $4,450–$4,475, only a short distance from key resistance around $4,500, after a year in which the price jumped by 64% and central banks such as the SNB booked tens of billions in valuation gains. The macro environment of moderate Fed easing expectations, elevated geopolitical risk, trade frictions and persistent central-bank demand continues to support the metal.
Technically, the structure is bullish while $4,400 holds, with clearly defined upside triggers and manageable downside levels. Flows from ETFs, index rebalancing and profit-taking explain the current range but do not contradict the broader uptrend.
On a 12–24-month horizon, the balance of probabilities favors further appreciation, with a credible path toward the $4,800–$5,000 band as long as the key supports are respected and global risk remains elevated.
On that basis, the strategic stance on Gold / XAU/USD is bullish – effectively a Buy, with pullbacks toward $4,310–$4,400 treated as opportunities to add exposure rather than reasons to abandon the trade.

That's TradingNEWS