Gold Price Forecast - XAU/USD Smashes Through $4,630 as Safe-Haven Rush Builds
Spot gold trades around $4,630–$4,650 at new all-time highs, silver tops $90 and investors rotate out of banks such as BAC and WFC into bullion as Iran tensions rise and Fed independence is questioned | That's TradingNEWS
Gold (XAU/USD) At Record Highs As Politics, Geopolitics And Rates Collide
Magnitude Of The Breakout In Spot And Futures
Spot Gold / XAU/USD is trading around $4,630–$4,640 with intraday spikes toward $4,647–$4,650, marking yet another all-time high. On the futures side, GC=F opened Wednesday at $4,594.30 per ounce, 0.1% below Tuesday’s $4,599.10 close, then advanced about 1.2% to set a fresh record near $4,647.60. On a one-week basis gold is up roughly 3.2%, over the past month about 7.4%, and over the last year around 71–72%. That performance is more typical of a growth equity than a defensive asset and shows that the market is not just hedging volatility; it is repricing the role of XAU/USD as a structural hedge in portfolios
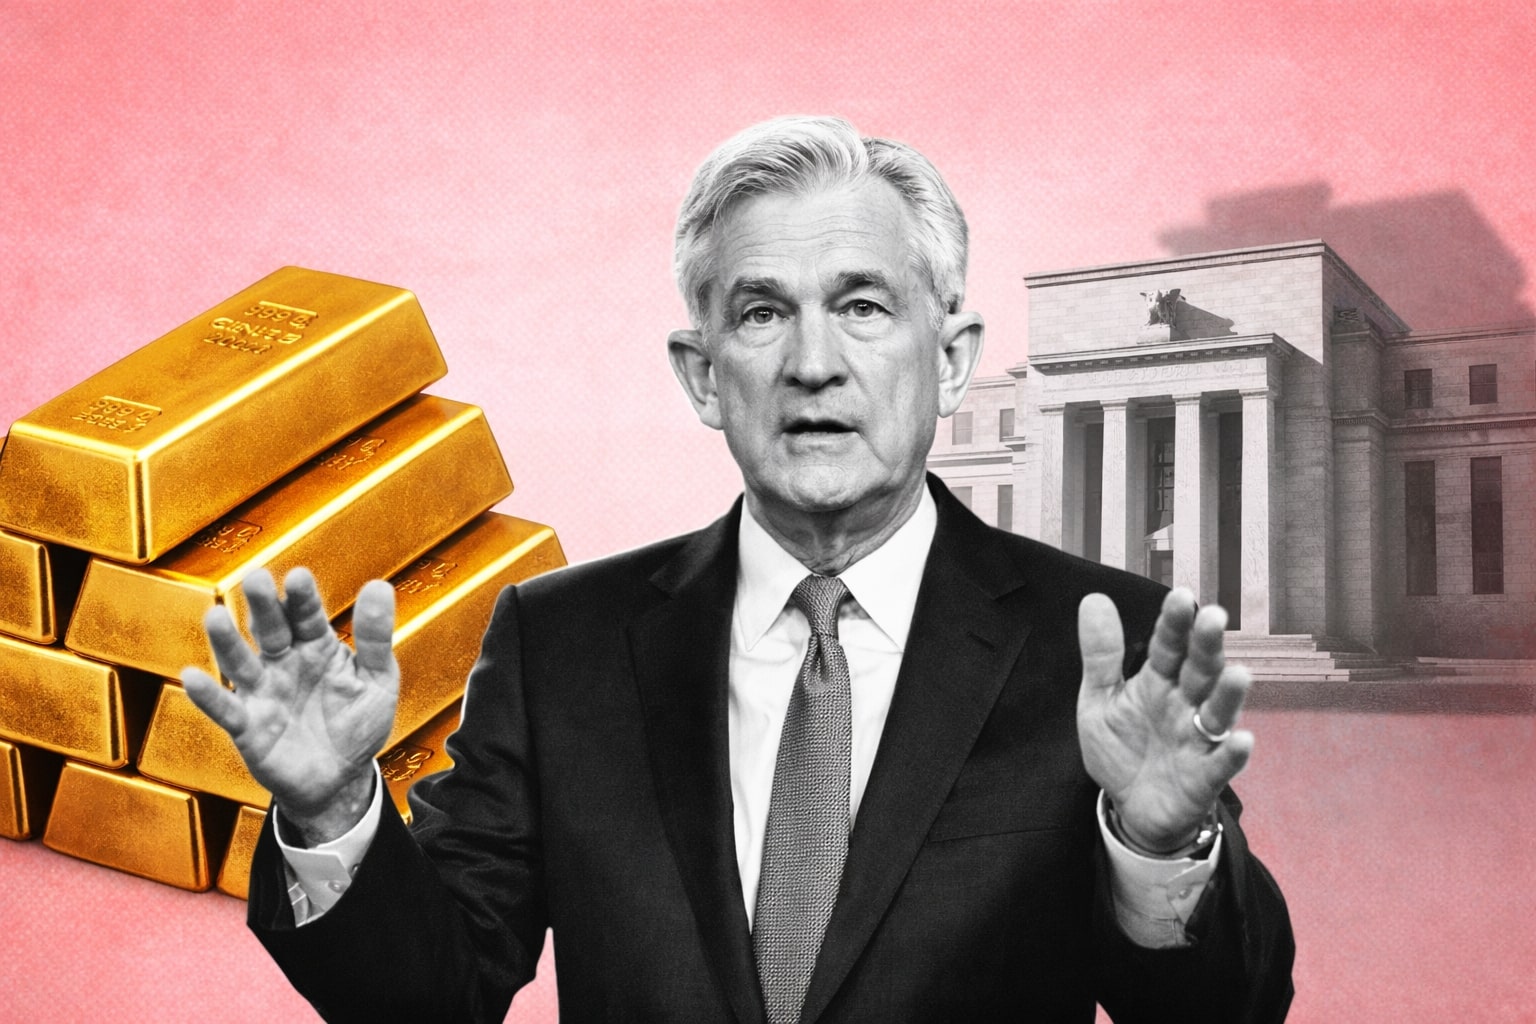
Fed Independence Shock As Core Driver Of The Safe-Haven Premium
The most important new driver of Gold / XAU/USD is institutional risk around the Federal Reserve. A criminal investigation and subpoena targeting Fed Chair Jerome Powell over testimony linked to building renovations is widely read as an escalation of political pressure on monetary policy. The same administration has already pushed publicly for lower rates, and a subpoena that threatens indictment effectively tests how far the executive branch can lean on the Fed. That move triggered a coordinated response from ten central bank and financial leaders, including signatories from the European Central Bank, Bank of England and key G10 and EM central banks, who stressed that central bank independence is a “cornerstone” of price and financial stability. The moment investors have to question whether the Fed can set rates without political interference, long-term confidence in nominal assets erodes and demand for politically neutral stores of value rises. Gold’s latest leg higher is the market putting a concrete price on that risk
US Inflation, Rate Path And Real Yield Backdrop For XAU/USD
The macro data do not contradict this move; they reinforce it. US core CPI just printed around 0.2% month-on-month and 2.6% year-on-year, marginally softer than expected and consistent with slow disinflation rather than an inflation relapse. Futures pricing still implies roughly two rate cuts in 2026, with the policy rate expected to stay on hold in January and remain in the 3.50%–3.75% band for now. That keeps real yields capped and occasionally negative in parts of the curve, which mechanically lowers the opportunity cost of holding non-yielding XAU/USD. The difference versus a standard “Fed cut” gold rally is the political overlay: the market is not merely betting that rates go lower; it is hedging the risk that rate decisions themselves become less credible. That combination of modest disinflation, capped real yields and perceived institutional fragility is exactly the environment in which gold tends to compound gains rather than retrace them
Iran Tensions And Middle East Risk As Secondary Catalyst
Geopolitical stress is the second leg of the move. Reports of intensifying protests in Iran, with estimated casualties in the low thousands, and open talk in Washington of possible intervention or deeper involvement, have pushed investors to re-rate Middle East risk. Safe-haven flows are visible across precious metals, with XAU/USD printing new records above $4,630 and oil benchmarks like Brent and WTI bouncing after multi-session gains. Fears of wider regional instability, potential disruption to supply routes and further shocks to already fragile energy balances add a risk premium that tends to support gold independently of the Fed story. As long as Iran remains in the headlines and the probability of escalation is not priced at zero, safe-haven demand is likely to stay elevated even on sessions with softer economic data
Silver Above $90 And The Broader Precious Metals Complex
The breakout is not confined to gold. Silver has pushed through the psychological $90 barrier for the first time, combining safe-haven flows with a strong industrial story. As gold marks new records, relative-value flows spill into silver: investors who see gold as “already rich” rotate toward what they perceive as lagging metals. At the same time, tight silver inventories and resilient fabrication demand keep a structural bid under prices. That is why silver’s day-to-day volatility exceeds gold’s and why rallies are often sharper. The fact that silver is now trading above $90 alongside XAU/USD near $4,640 underscores that this is a complex-wide re-pricing of precious metals, not just a single-asset spike
Swiss And FX Angle: XAU/USD Versus CHF Returns
For CHF-based investors, the move in Gold / XAU/USD has to be viewed through USD/CHF. Gold is quoted globally in dollars, while Swiss portfolios are measured in francs. Vaulted bars in Zurich, Swiss-domiciled ETFs and ETCs all translate USD metal prices into CHF returns in real time. If USD/CHF softens while XAU/USD rises, local returns are dampened; if the dollar firms alongside gold, CHF returns are amplified. Investment gold is generally exempt from Swiss VAT, while most silver products are not, which makes gold structurally cheaper to hold than silver once taxes and storage are included. In practice, Swiss allocators often pair gold holdings with CHF cash or short-dated franc bonds, using bullion as the hedge against both US policy risk and any future question marks around SNB or ECB policy
Flows, ETFs And The Safe-Haven Allocation Shift
Safe-haven flows are visible in listed products and institutional positioning. Recent sessions have seen renewed inflows into gold-backed ETFs and physically-collateralized products as well as increased bid interest from central banks and large asset managers. At the same time, futures positioning has leaned more constructive, with outright longs increasing while fresh speculative shorts are limited, reflecting the risk of being structurally short into headlines about Iran or Fed independence. This is not an environment where leveraged speculative froth is driving XAU/USD; it is a steady reallocation from rate-sensitive assets and parts of the banking sector into gold and, to a lesser extent, silver and miners
Bank Earnings, BAC, WFC And Equity Rotation Toward Gold
The equity tape is reinforcing the allocation story. The S&P/TSX composite has pulled back marginally from record highs even as gold miners and resource names gain, helped by the surge in XAU/USD to above $4,620. At the same time, US bank stocks have faced pressure. JPM, which kicked off US bank earnings, reported weaker Q4 profit due to provisions tied to its Apple credit card portfolio and warned that the Trump administration’s proposed cap on credit-card interest rates could compress returns across the industry. That warning weighed on financials, with BAC, WFC and C trading softer as investors reassessed the sector’s medium-term profitability. When you combine sector-specific regulation risk in banks with macro political pressure on the Fed and geopolitical stress in Iran, the relative case for raising exposure to gold versus financials becomes straightforward. Capital that rotates out of BAC, WFC and their peers needs a defensive home; Gold / XAU/USD and gold-linked equities are natural beneficiaries
Technical Structure: Momentum, RSI And Key Levels For XAU/USD
Technically, XAU/USD is extended but not yet broken. Spot trades around $4,634, with Tuesday’s low near $4,570 acting as immediate support and the early-January low just below $4,500 as the first deeper cushion. The prior resistance zone around $4,400 now behaves as a structural support band. The 50-day moving average sits much lower, around the $4,300 region, underlining how far price has run ahead of medium-term trend references. On shorter-timeframe charts, the 4-hour RSI is flirting with overbought territory and showing early bearish divergence – price makes a new high while RSI peaks slightly lower. The MACD histogram on those timeframes is contracting and starting to tilt lower, signalling that upside momentum is slowing even as price grinds into record territory. Extension targets derived from the January 8–12 leg put the next Fibonacci zones around $4,689 (127.2% extension) and $4,763 (161.8% extension). Separately, the measured move from the large ascending triangle pattern points closer to $4,900 as an eventual objective if the current breakout completes
Risk Of Pullback: What Would A Healthy Correction In XAU/USD Look Like
An overstretched rally does not automatically mean a reversal; it often means the character of the move changes. For XAU/USD, a “healthy” correction would be a drop back toward $4,570–$4,500 without breaking the $4,400 band. That type of pullback would cool short-term momentum, reset the RSI and MACD, and give longer-term buyers an opportunity to add risk at lower levels. A deeper flush that tests the $4,300 region around the 50-day moving average would still leave the primary uptrend intact, given the scale of the breakout and the macro drivers behind it. Only a sustained move under $4,300, combined with a clear easing of Iran tensions and credible de-escalation of the Fed independence issue, would suggest that the current phase is topping rather than consolidating
Read More
-
Salesforce Stock Price Forecast - Why CRM Stock Around $238 Still Discounts Agentforce And 34% FCF
14.01.2026 · TradingNEWS ArchiveStocks
-
XRP Price Forecast - XRP-USD Holds Above $2 as Luxembourg EMI and CLARITY Act Cut Regulatory Risk
14.01.2026 · TradingNEWS ArchiveCrypto
-
Oil Price Forecast: WTI Oil Breaks Out Toward $62 as Brent Jumps Above $66 on Geopolitical Risk
14.01.2026 · TradingNEWS ArchiveCommodities
-
Stock Market Today - Dow Slides to 48,977 as BAC, WFC Sink and Gold Blasts to $4,621
14.01.2026 · TradingNEWS ArchiveMarkets
-
GBP/USD Price Forecast - Pound Holds 1.34–1.35 Band As Fed Independence Shock Offsets Strong US Numbers
14.01.2026 · TradingNEWS ArchiveForex
Interaction With Real Yields, USD And Cross-Asset Volatility
Cross-asset links remain central to the XAU/USD outlook. Lower or sideways real yields in the US reduce the opportunity cost of holding gold. If the 10-year real yield continues to grind lower while nominal yields are capped by disinflation and political pressure on the Fed, the macro environment remains gold-friendly. The dollar index has softened modestly, but not collapsed; a sharp USD selloff would strengthen gold in non-USD terms even further, while a sudden dollar spike on risk-off or policy surprise would partially offset gold’s nominal gains for non-US investors. Equity volatility is creeping higher as well, with implied volatility indexes lifting from recent lows. Rising volatility in stocks historically coexists with stronger gold as portfolios look for ballast. The key point is that the fundamental and cross-asset signals are aligned: moderate disinflation, debated Fed independence, elevated geopolitical risk and bouts of equity and rate volatility all push in the same direction for XAU/USD
Positioning Strategy: How Professional Money Is Likely To Trade This Tape
From a trading and allocation standpoint, the dominant professional stance is likely to be “buy dips, avoid chasing blow-off spikes”. That translates into staged entries on pullbacks towards $4,570, $4,500 and, in more extreme corrections, the $4,400–$4,300 area, while avoiding fresh leverage at or above $4,700 unless the macro backdrop deteriorates drastically. Systematic and rules-based mandates will calibrate position sizes to volatility, meaning that even as XAU/USD trends higher, gross exposure may be capped to keep portfolio risk stable. Discretionary macro funds are likely to run a core long gold exposure funded partly by underweights in US financials, selective EM FX and, in some cases, lower beta to long-duration bonds where policy uncertainty is highest. For investors using ETFs or vaulted metal, the equivalent is keeping a strategic allocation in place and adding tactically on corrections rather than cutting exposure on every $50 pullback
Gold (XAU/USD) Verdict – Bullish Bias, Effectively A Buy-On-Dips
Taking all data together – record highs near $4,640, political stress around Fed independence, Iran tensions, disinflation that caps real yields, sector-specific risk in banks like BAC and WFC, and a technical structure that is stretched but not broken – Gold / XAU/USD remains fundamentally bullish. The rally is driven by structural shifts in perceived policy risk and geopolitical uncertainty, not by fleeting speculative mania. The probability of a noisy, 3–7% pullback is high given the speed of the move, but the probability that such a pullback marks a lasting top is lower as long as Fed independence remains questioned and Middle East risk elevated. On that basis, the rational stance on a 6–12 month horizon is bullish, functionally a Buy on pullbacks rather than a Sell, with a working upside map toward $4,700–$4,900 and key downside risk zones clustered between $4,500 and $4,300 where the strength of real money demand will be tested