Energy Market Backdrop and Crude Price Dynamics
Brent crude is trading near $72.40 per barrel and WTI around $69.75, levels that have held since late July as OPEC+ members debate whether to reintroduce up to 2.2 MM bpd of previously curtailed supply. U.S. output remains steady at roughly 13.4 MM bpd, reinforcing America’s status as the world’s largest producer. Natural gas futures for September delivery sit at $3.12/MMBtu, reflecting moderate demand for power-generation and LNG exports despite record storage inventories of 3,123 Bcf as of July 25 (EIA). This interplay between stable oil pricing and abundant gas supplies underpins the mid-cap exploration and production complex.
ETF Structure, Weighting and Sector Mix
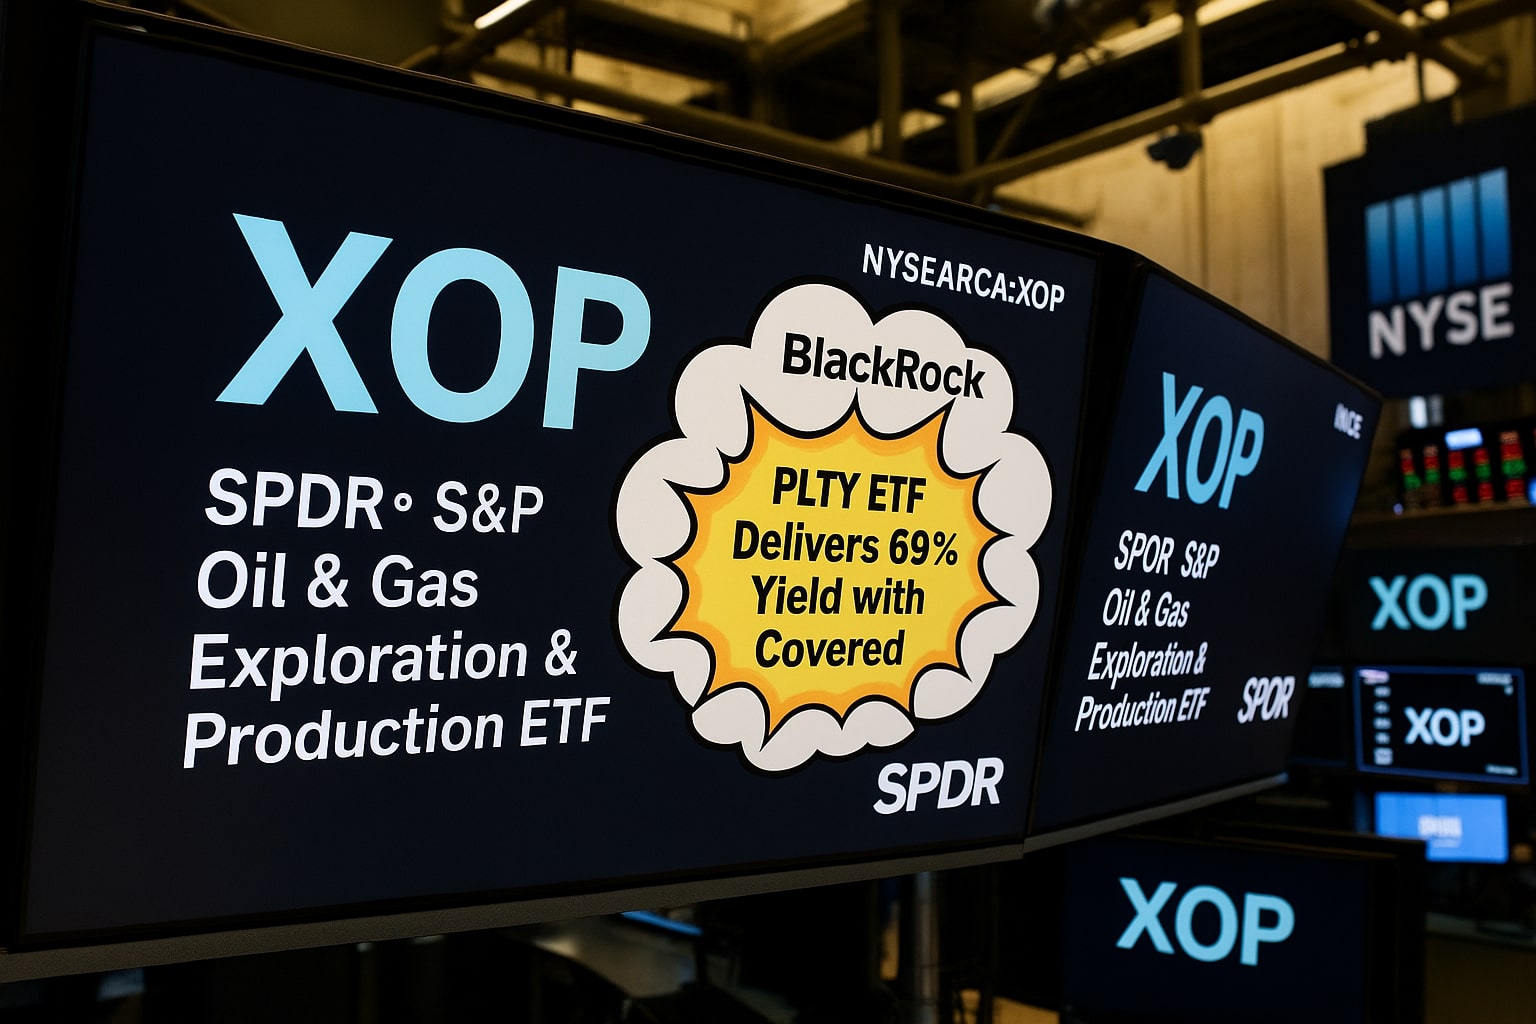
The SPDR S&P Oil & Gas Exploration & Production ETF (NYSEARCA:XOP) employs an equal-weight approach across 50 mid-cap companies drawn from the S&P Oil & Gas E&P Select Industry Index. Upstream names comprise 71.6 % of assets, Refining & Marketing accounts for 19.2 %, and Integrated Oil & Gas firms represent 9.2 %. This diversification shields investors from crude price gyrations by pairing pure-play drillers like Chord Energy (CHRD) and EQT Corporation (EQT) with refiners such as Valero Energy (VLO) and Marathon Petroleum (MPC). No single holding exceeds 3.33 % of total assets, ensuring that M&A catalysts in smaller issuers can meaningfully boost returns.
Liquidity, Expense Profile, and Income Generation
With assets under management of $1.92 billion and average daily volume above 2 million shares, XOP delivers tight bid-ask spreads for both institutional and retail traders. Its 0.35 % expense ratio is competitive within the energy ETF universe, notably lower than the 0.57 % charged by gas-focused peers. The ETF’s SEC yield of 2.54 % translates to a distribution yield of 2.60 %, offering a steady income stream while preserving upside participation in commodity price moves.
Valuation Landscape and Relative Multiples
On a trailing twelve-month basis, XOP’s P/E ratio stands at 11.6 and its Price/Book ratio at 1.27, trading at a discount to the diversified energy sector’s P/E of approximately 13.8 and P/B of 1.45. Mid-cap weighting captures the historical premium that acquirers pay—often 20–30 % above pre-deal trading prices—while its downstream allocation benefits from refining margins that have averaged $15.20/barrel so far in 2025 (IEA).
Performance Trends and Historical Returns
Over the past year, XOP has declined 11.5 % versus –9.6 % for the broader Energy Select Sector SPDR (XLE), reflecting underperformance in smaller cap names amid range-bound oil. Yet its five-year return of +22.1 % outstrips XLE’s +16.4 %, highlighting resilience through multiple commodity cycles. Since January’s breakout above $64, XOP’s NAV has traded in a $65–$72 corridor, repeatedly finding support at its 200-day simple moving average near $65.30.
Macro Policy Drivers and Trade Agreements
U.S. energy policy has tilted back toward hydrocarbons with the early expiration of renewable tax credits under the One Big Beautiful Bill Act, while a $750 billion U.S.-EU trade pact mandates increased American energy exports through 2028—predominantly natural gas. These developments dovetail with a projected 4 % rise in upstream capital spending in 2025 (EY), fueling exploration activity that will directly benefit mid-cap producers in XOP’s holdings.
Technical Indicators and Market Sentiment
Momentum oscillators for XOP show an RSI near 46, suggesting a neutral stance with room for upside if crude sustains above $70. Open interest in XOP options has risen 15 % this quarter, reflecting hedging activity and speculative positioning after prolonged redemptions. ETF inflows have quietly resumed, with $45 million net new assets flowing in during the last week of July, a sign that investors are rotating back into energy amid broader market volatility.
M&A Prospects and Mid-Cap Catalyst Potential
Mid-cap exploration names—such as CNX Resources (CNX), whose stock rallied 28 % in Q2 on reported takeover talks—offer high-impact upside when larger peers pursue strategic bolt-on acquisitions. Historically, mid-cap E&P M&A deals in the Permian Basin have commanded premiums exceeding 25 %, a dynamic that XOP equally weights to capture across its 50-name roster.
ESG and Transition Considerations
While upstream exposure carries carbon intensity risks, several XOP constituents, including Occidental Petroleum (OXY), are deploying carbon capture and storage (CCS) technologies targeting 50 % emissions reductions by 2030. This measured pivot toward lower-carbon operations may mitigate regulatory risks as jurisdictions tighten methane leak rules and accelerate EV adoption beyond current estimates of 15 % new vehicle sales by 2030.
Portfolio Positioning and Tactical Allocation
For multi-sector portfolios underweight energy, a 5–7 % allocation to XOP can enhance diversification and yield potential, particularly as capex growth, favorable trade frameworks, and mid-cap M&A activity converge. Tactical overweight in XOP may outperform in scenarios where oil stabilizes above $70 and natural gas remains above $3/MMBtu—both conditions baked into forward futures curves.
Risk Factors and Volatility Controls
Commodity price swings remain the primary risk for XOP. A sudden surge in U.S. shale output or global demand setbacks could depress equity values rapidly. However, XOP’s equal-weight structure and downstream buffer lower single-name and oil price concentration risk. Volatility can be further tempered by overlay strategies, such as writing covered calls on the ETF at strike prices near $74, capturing premium while capping upside modestly.
Real-Time Chart and Further Research
Investors can follow XOP’s live performance on TradingNews Real-Time Chart to monitor NAV fluctuations, volume spikes, and technical trigger levels. Deep-dive holdings analysis and daily sector flows are available on the same platform.
Having woven together macro policy shifts, refined valuation metrics, technical signals, and mid-cap acquisition catalysts, XOP emerges as a finely balanced vehicle for energy-sector exposure, blending income generation with upside in exploration-led rallies. This nuanced positioning makes it a compelling addition to any portfolio seeking both yield and commodity linkage.


